• Skip to primary navigation
  • Skip to main content
  • Skip to primary sidebar

Earth Wise

A look at our changing environment.

  • Home
  • About Earth Wise
  • Where to Listen
  • All Articles
  • Show Search
Hide Search
You are here: Home / Archives for winds

winds

Rainforests and thunderstorms

August 6, 2025 By EarthWise Leave a Comment

Thunderstorms have a surprising impact on tree mortality

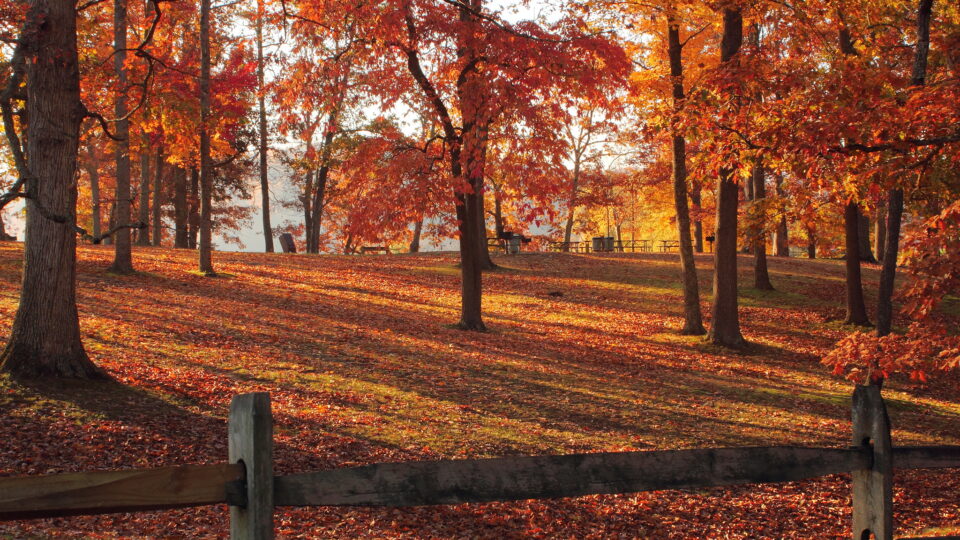
Tropical forests are dying at an alarming rate, and not just from deforestation. Even intact forests are losing trees, threatening biodiversity, carbon storage, and the global climate. While drought and rising temperatures are often blamed, new research points to a surprising culprit: thunderstorms.

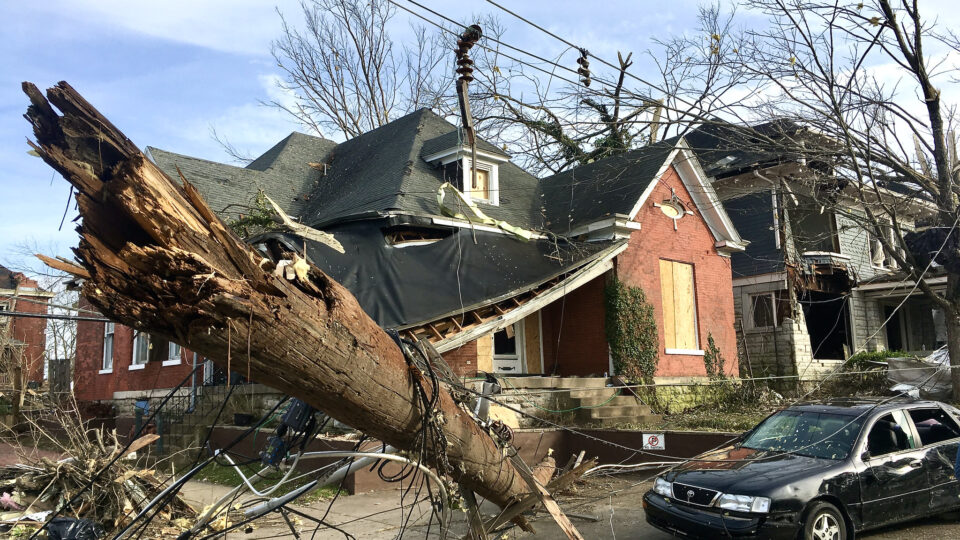
These intense, short-lived convective storms, common in the tropics, are increasing due to climate change. With strong winds and lightning, they can snap trees, strip canopies, and kill even the most robust tree specimens.

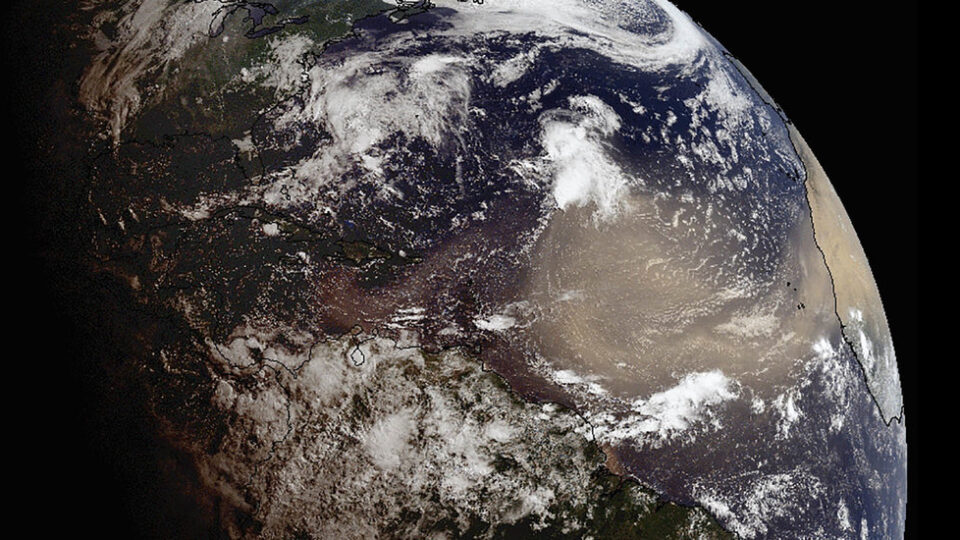
In a perspective paper recently published in the journal Ecology Letters, a research team led by the Cary Institute of Ecosystem Studies argues that thunderstorms, often overlooked in carbon storage research, may be the leading cause of tree death in tropical forests. The research team estimates that storms have caused 30 to 60% of tree mortality in the past, a number that is likely rising as storm activity increases 5 to 25% each decade.

Including storm data in forest carbon studies changes the picture significantly. Earlier models showed that carbon levels dropped sharply when temperatures rose beyond a certain point. But when storm impacts were added, that pattern disappeared, suggesting that storms – not just heat – may be a key factor in carbon loss.

Understanding which species are most vulnerable is critical for reforestation and conservation efforts. Mature trees store the most carbon, so if they’re lost to storms, future forests may fall short of their carbon storage potential.

As storm activity increases each decade, the stakes grow higher.  Accounting for storms could reshape how we protect, restore, and plan for the future of our forests. 

**********

Web Links

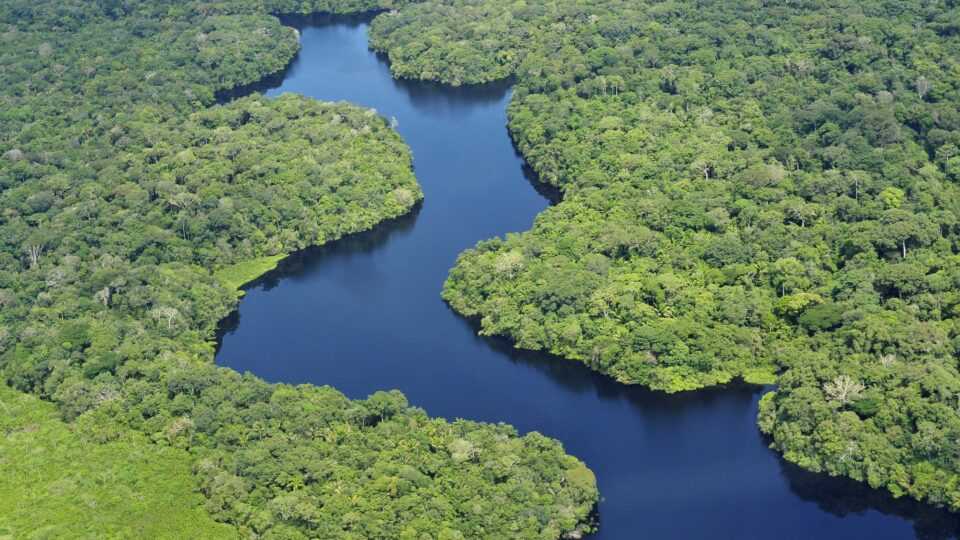
Are the Amazon’s biggest trees dying? Forest coroners investigate

Photo, posted July 2, 2017, courtesy of Anna & Michal via Flickr.

Earth Wise is a production of WAMC Northeast Public Radio

The largest iceberg runs aground

April 10, 2025 By EarthWise Leave a Comment

The largest iceberg in the world, which has been slowly drifting for nearly 5 years, has finally come to a halt.  The iceberg – called the unexciting name A-23A – came into existence in 1986 when it broke off from another iceberg A-23 that had calved or torn off from Antarctica earlier that year.  For decades, A-23A sat in the Weddell Sea, east of the Antarctic Peninsula.  Then, in 2020, it came loose from the seafloor and began to move.  By 2023, it finally left Antarctic Waters.

Late last year, it began spinning in place caught in an ocean current called a Taylor column.  Finally, it headed for South Georgia, a British-owned island that is home to a couple dozen people and lots of seals and penguins.  A-23A is now stuck on the continental shelf, about 50 miles from the island.

A-23A is around 1,300 square miles in area.  By comparison, New York City is 300 square miles.

Four years ago, a large iceberg called A-68A also came to ground in the vicinity of South Georgia.  It quickly broke apart and ultimately added 150 billion metric tons of fresh water to the ocean as well as various nutrients.  A-23A is also likely to succumb to the warmer waters, winds, and currents it now encounters and will affect the flora and fauna in the area.

The climate is changing and is impacting how ice shelves melt.  Calving and the creation of mammoth icebergs are a normal part of the lifecycle of polar ice sheets, but we are likely to see even more events like this in the future.

**********

Web Links

World’s Largest Iceberg Runs Aground

Photo, posted January 29, 2011, courtesy of Drew Avery via Flickr.

Earth Wise is a production of WAMC Northeast Public Radio

The green grab for land

March 27, 2025 By EarthWise Leave a Comment

Solar and wind farms are spreading rapidly around the world.  Many economists believe that solar power has crossed the threshold where it is generally cheaper than other ways to make electricity and will become the dominant energy source in the next couple of decades.  As a result, both solar and wind farms are gobbling up more and more land around the world.  Estimates are that they will take up around 30,000 square miles by mid-century.

One concern is whether we are entering an era of trading food for energy.  Land conflicts seem inevitable since solar power operates best in unshaded areas with gentle winds and moderate temperatures, which are the same conditions favored by many crops.

China is installing more solar farms than the rest of the world combined.  Many of these are in the Gobi Desert, where there is no competing need for the land.  But some are in eastern China, in densely populated grain-growing areas.

There are a number of strategies that reduce the impact of solar farms on land use.  One approach is to put them on old industrial or brownfield sites that are otherwise unusable.  Another is floatovoltaics:  putting solar panels on the surface of lakes and reservoirs.  And then there is agrivoltaics, where solar panels are installed above crop fields or where livestock graze between or even beneath solar arrays.  China has more than 500 agrivoltaic projects that incorporate crops, livestock, aquafarming, greenhouses, and even tea plantations.

Green energy has both environmental and economic benefits to offer, but it must conserve nature and not excessively grab land needed for people, wildlife, and ecosystems.

***********

Web Links

‘Green Grab’: Solar and Wind Boom Sparks Conflicts on Land Use

Photo, posted May 25, 2011, courtesy of Michael Mees via Flickr.

Earth Wise is a production of WAMC Northeast Public Radio

Pollution in downwind states

August 26, 2024 By EarthWise Leave a Comment

Pollution in downwind states

Air pollution is a serious health threat.  It is associated with asthma and can lead to chronic disease, cancer, and premature death.  Globally, air pollution kills 7 to 9 million people, and 200,000 Americans die from it each year.

There are multiple sources of air pollution including automobiles, power plants, and other industrial activities.  Exposure to pollutants such as nitrogen oxide, sulfur dioxide, and particulate matter does not require living or working near their sources.  Winds can carry pollution great distances including across state lines.  

The Clean Air Act included the EPA’s “Good Neighbor Plan”, which requires “upwind” states to implement plans to reduce emissions from power plants and other industrial sources.  However, three states – Indiana, Ohio, and West Virginia – along with various industrial companies and trade organizations sued the EPA when it tried to enforce these plans.  A recent Supreme Court decision to block a federal rule curbing interstate air pollution further complicates efforts to reduce emissions.

As a result, there is a disproportionate burden on downwind states.  They face major challenges in demonstrating and attributing air pollution to sources across state lines and pursuing legal actions to get the EPA to address their problems.

A recent study by the University of Notre Dame looking at all the complex issues related to interstate pollution underscored how the regulatory system continues to be hamstrung when attempting to address a serious threat to human health and the environment.

**********

Web Links

Downwind states face disproportionate burden of air pollution

Photo, posted February 19, 2021, courtesy of David Wilson via Flickr.

Earth Wise is a production of WAMC Northeast Public Radio

A brief bout of bad air in Scotland

July 3, 2024 By EarthWise Leave a Comment

Explaining a brief period of poor air in Scotland

Scotland, and the UK in general, used to suffer from sulfur dioxide pollution.  Industrial and domestic emissions, especially from burning coal, contributed heavily to urban air leading to the London smog of the 1950s and the acid rain of the 1980s.  But national air pollution agreements and various international measures have been highly successful in reducing sulfur dioxide emissions.  Desulfurization of coal-fired powerplants and the introduction of ultralow sulfur fuels among other measures have decreased sulfur dioxide emission by 98% since 1970. 

As a result, it came as quite a surprise on May 31st when Edinburgh saw sulfur dioxide levels higher than had been observed in over 30 years.  The levels greatly exceeded air quality objectives for 10 hours with concentrations even creeping towards workplace exposure limits.

What happened?  For once, it was nothing that people did.  Two days earlier, a volcanic fissure eruption took place in the Reykjanes Peninsula in Iceland, some 850 miles from Edinburgh.  Because of an unusual meteorological configuration, the prevailing winds sent the plume of volcanic gases southward towards Scotland.  Had the eruption taken place 60 miles further north or happened a few hours later, the plume of gases would have missed the UK entirely and would have traveled north to the Arctic region.

Icelandic volcanic eruptions have impacted air travel in Europe on a number of occasions.  This non-explosive eruption had little impact outside of its local region, but it turned out to briefly wreak havoc in Scotland.  Fortunately, this pollution event was short-lived.

**********

Web Links

Atmospheric sulphur dioxide levels reach historic high in Scotland following Icelandic volcano eruption

Photo, posted November 17, 2021, courtesy of Catherine Poh Huay Tan via Flickr.

Earth Wise is a production of WAMC Northeast Public Radio

An active hurricane season

May 13, 2024 By EarthWise Leave a Comment

The Atlantic hurricane season officially runs from June 1st until November 30th.  Forecasters at Colorado State University have issued forecasts of Atlantic basin hurricane activity since 1984 based on the pioneering work of Professor William Gray.  This year’s forecast, issued in April, predicts a higher-than-average number of Atlantic storms.  In fact, it may be one of the most active seasons on record.

On average, there are 14 named storms each season.  This year, the prediction is for 23 of them.  On average, there are 7 hurricanes each season.  This year, the prediction is for 11. The prediction is for 5 major hurricanes among them.  These predictions are among the highest on record, although in 2020 they predicted 12 hurricanes.  In fact, that year there were 14 that actually took place.

Among the factors at play are that the El Niño that was occurring last year has dissipated and there is a good chance of a La Niña forming, which suppresses upper-level winds thereby making conditions ideal for hurricane formation and intensification.  But the overarching factor is global warming which is driving ocean temperature rise.  The water in the Atlantic, especially in the eastern Atlantic where most hurricanes form, has seen record-breaking warmth.  More warm water means more chances for storms.

Other research groups echo the predictions from Colorado State and, in some cases, see ever greater chances for an extremely active hurricane season.  The University of Pennsylvania forecast calls for 33 named storms.

The overall forecast is for a well above-average probability for major hurricanes making landfall along the continental United States coastline and the Caribbean. 

**********

Web Links

Weather tracker: US experts predict one of most active hurricane seasons on record

Photo, posted September 5, 2017, courtesy of NASA/NOAA GOES Project via Flickr.

Earth Wise is a production of WAMC Northeast Public Radio

Global Stilling | Earth Wise

October 20, 2022 By EarthWise Leave a Comment

Making wind turbine blades recyclable

During the summer of 2021, much of Europe experienced a “wind drought” – wind speeds in many places were about 15% below average.  In the UK in particular, winds were unusually calm and wind energy production was dramatically reduced.

Globally, wind speeds have been dropping by about 2.3% per decade since the 1970s.  In 2019, however, global average windspeeds actually increased by about 6%.  The question is whether a trend of slowing winds – so-called global stilling – is associated with climate change or is just natural variability in action.

Wind results from uneven temperatures in air masses.   Much of the world’s wind comes from the difference between the cold air at the poles and the warm air at the tropics.  Because the Arctic is warming much faster than the tropics, it is possible that winds will continue to decline around the world. 

Another factor people cite is the increase in surface roughness.  The number and size of urban buildings continues to increase, which acts as a drag on winds.

Some models predict that wind speeds will decrease over much of the western U.S. and East Coast, but the central U.S. will see an increase.  Experts do not all agree about what is happening with global winds.  Many believe that the observed changes to date have been within the range of variability.  Furthermore, some places have been windier than usual.

All of this really matters for many reasons.  Europe is increasingly dependent upon wind power as an alternative to fossil fuels.  A 10% drop in wind speed results in a 30% drop in energy generation.   Whatever their cause may be, wind droughts cannot be ignored.

**********

Web Links

Global ‘Stilling’: Is Climate Change Slowing Down the Wind?

Photo, posted June 28, 2008, courtesy of Patrick Finnegan via Flickr.

Earth Wise is a production of WAMC Northeast Public Radio

Atmospheric Plastic Polluting The Ocean | Earth Wise

June 8, 2022 By EarthWise Leave a Comment

Winds carry plastic particles all around the world

According to estimates, by 2040 there will likely be nearly 90 million tons of plastic pollution entering the environment each year.  Particles of plastic have been found in virtually all parts of our planet including the land, the water, and even the air.  Tiny plastic particles have been found in the Arctic, the Antarctic, and at the tops of the highest mountains.

A new study has shown that winds can carry plastic particles over great distances and in fact can bring them from their point of origin to the most remote places in a matter of days.   As a result, micro- and nanoplastics can penetrate the most remote and otherwise largely untouched regions of the planet

How does plastic get into the atmosphere?  Particles produced by tires and brakes in road traffic or ones in the exhaust gases from industrial processes rise into the atmosphere, where they are transported by winds.  There is also evidence that a substantial number of these particles are transported by the marine environment.  Microplastic from the coastal zone finds its way into the ocean through beach sand.  A combination of sea spray, wind, and waves forms air bubbles in the water containing microplastic.  When the bubbles burst, the particles find their way into the atmosphere.

Understanding the interactions between the atmosphere and ocean is important because the atmosphere turns out to be a major mechanism in depositing substantial amounts of plastic into a broad range of ecosystems.

The impact of plastic particles on ecosystems is not well understood.  Neither is the effect of plastic particles in the air upon human health.  In a recent British study, microplastic was detected in the lungs of 11 out of 13 living human beings.

**********

Web Links

Micro- and nanoplastic from the atmosphere is polluting the ocean

Photo, posted April 25, 2016, courtesy of Bo Eide via Flickr.

Earth Wise is a production of WAMC Northeast Public Radio.

River Of Dust | Earth Wise               

April 25, 2022 By EarthWise Leave a Comment

Every year, more than 100 million tons of dust blow out of North Africa.  Strong seasonal winds lift the dust from the Sahara Desert northward.  A few times a year, the winds from the south are strong and persistent enough to drive the dust all the way to Europe.

On March 15, a large plume of Saharan dust blew out of North Africa and crossed the Mediterranean into Western Europe.  European cities were blanketed with the dust, degrading their air quality, and turning skies orange.  Alpine ski slopes were stained with the dust.

These dust events are associated with so-called atmospheric rivers that arise from storms.  Such rivers usually bring extreme moisture but can also carry dust.  Over the past 40 years, nearly 80% of atmospheric rivers over northwestern Africa have led to extreme dust events over Europe.  The March 15 event was associated with Storm Celia, a powerful system that brought strong winds, rain, sleet, hail, and snow to the Canary Islands.

Atmospheric dust plays a major role in climate and biological systems.  The dust absorbs and reflects solar energy and also fertilizes ocean ecosystems with iron and other minerals.

The climate effects of dust are complicated.  Dust can decrease the amount of sunlight reaching the surface, affect cloud formation, and decrease temperatures.  But dust also darkens the snowpack, leading to more rapid snowmelt.  A 2021 dust event resulted in a rapid melt of Alpine snow, reducing its depth by half in less than a month.

The effects of this year’s dust event are not yet known, but this atmospheric river associated with Storm Celia appeared to carry less water and more dust compared with the 2021 event.

**********

Web Links

An Atmospheric River of Dust

Photo, posted December 2, 2019, courtesy of Catherine Poh Huay Tan via Flickr.

Earth Wise is a production of WAMC Northeast Public Radio.

Is It Really Getting Warmer? | Earth Wise

March 28, 2022 By EarthWise Leave a Comment

The primary indicator of global climate change is the Global Mean Surface Temperature of the Earth and the world’s nations are trying to keep its increase below 1.5 degrees Celsius over the pre-industrial level.   That rise in temperature is called the Global Surface Temperature Anomaly and it actually reached an all-time high in 2016 at 1.02 degrees before going back down.

At this point, you might be saying, “hold on there…  it hasn’t gotten larger over the past 5 years?”  What’s going on?

The global climate is pretty complicated and there are many things that influence it.  One of the most significant factors is the El Niño Southern Oscillation or, more familiarly, the El Niño.  The El Niño is a periodic and irregular variation in the sea surface temperature of the tropical eastern Pacific Ocean driven by persistent westerly winds.  When an El Niño is happening, currents move to the west coast of South America and warm the tropics and subtropics.  This causes a spike in the global mean temperature.  There was a strong El Niño in 2016.

On the other hand, when easterly winds dominate to form a La Niña, cool water comes up from the depths of the Pacific and cools the atmosphere.  In 2017 and 2018, there was a fairly strong La Niña, lowering the global mean temperature.  2020 had no El Niño or La Niña, and the global temperature went back up to its previous peak.  Last year, there was again a La Niña and the temperature dipped again.

The global mean surface temperature has been rising in the industrial era, but it also fluctuates with the complicated dynamics of the Pacific Ocean.

**********

Web Links

Why Isn’t It Getting Warmer?

Photo, posted February 12, 2016, courtesy of Amit Patel via Flickr.

Earth Wise is a production of WAMC Northeast Public Radio.

Climate Change On Mount Everest | Earth Wise

March 21, 2022 By EarthWise Leave a Comment

Climate change has shown up in the highest place on Earth.  The highest glacier on Mount Everest is rapidly retreating with rising temperatures.

New research by an international team led by the University of Maine and published in the journal Climate and Atmospheric Science has determined that the South Col Glacier atop Mount Everest has shrunk by half since the 1990s.   Its ice mass has thinned by an estimated 180 feet.

The glacier used to be covered by snow, which reflected the sun’s light and insulated the mass of ice under the snow.  But warmer temperatures, lower humidity, and more severe winds have eliminated the snow cover, fueling the decline of the glacier.

The study of the South Col Glacier highlights the critical balance created by snow-covered surfaces and exposes the potential for loss throughout high mountain glacier systems as snow cover is depleted by warming temperatures.  When even the highest glacier on Mount Everest is impacted, it is clear that no place is safe from the warming climate.

The human significance of this development is substantial.  More than 200 million people in Asia depend on meltwater from glaciers in the high mountains of the continent for their freshwater needs.  But now glaciers in the mountains are melting faster than they can be replenished by snowfall.

As for Mount Everest itself, future expeditions on the mountain will face new challenges as glacier melting causes more avalanches and climbers accustomed to digging into ice and snow will need to scale more exposed bedrock.  Climate predictions for the Himalaya in general all anticipate continued warming and continued loss of glacier mass.

**********

Web Links

Climate Change Has Reached the Top of Mount Everest, Thinning Its Highest Glacier

Photo, posted October 27, 2011, courtesy of Goran Hogland via Flickr.

Earth Wise is a production of WAMC Northeast Public Radio.

Keeping Venice From Flooding | Earth Wise

January 6, 2022 By EarthWise Leave a Comment

Venice can hold back the Adriatic Sea

Since 2003, Venice Italy has been building a system of mobile gates at three inlets to its famous lagoon.  The project is called MOSE, the Italian word for Moses, but is actually an acronym for the Italian words meaning Experimental Electromechanical Module.  

The 78 mobile gates are metal box structures that sit at the bottom of inlet channels.  When a high tide is predicted, compressed air is pumped into the structures.  The air causes the barriers to rise up to the surface and block the flow of the tide, thereby preventing water from flowing into the lagoon.

The system had an important test on November 3 when water levels were predicted to rise four-and-a-half feet above normal at high tide and strong winds were blowing.  Water at that level is enough to flood 60% of the city, including the famous St. Mark’s Square, which is unfortunately the lowest part of the city.

Activating the flood gates proved to be successful.  Even though high tide water levels in fact rose 4.3 feet in the surrounding Adriatic Sea, they only reached 2.7 feet in Venice, which was enough to prevent significant flooding.

Rising sea levels have led to increasingly frequent floods in Venice.  In 2019, before the MOSE system was available for use, there were more than 25 high-water events swamping Venice, including one in November of that year that was the second worst on record.

Some researchers have calculated that the system will need to be closed for as much as 3 weeks a year by the end of the century even if emission reductions are reasonably effective.  If they aren’t, the gates may be closed for at least two months a year by 2080.

After many years of delays, setbacks and controversies, the system is finally operational.

**********

Web Links

Venice Holds Back the Adriatic Sea

Photo, posted October 25, 2014, courtesy of Pedro Szekely via Flickr.

Earth Wise is a production of WAMC Northeast Public Radio.

Nanoplastics In The Air | Earth Wise

December 17, 2021 By EarthWise Leave a Comment

Austria, Silvretta mountains

The world is awash in plastic.  Discarded plastic litters our roadways, woodlands, and beaches.  It piles up in landfills.  Plastic enters the oceans by the millions of tons.  And plastic is finding its way even to remote and supposedly pristine parts of the world.

A team of researchers has found nanoplastics at the isolated high-altitude Sonnblick Observatory in the Austrian Alps.  This is the first time the particles were found in the area.  The researchers were looking for certain organic particles and only found the nanoplastics by chance.

The detected plastic particles were less than 200 nanometers in size, about one hundredth the width of a human hair.  It is highly unlikely that such particles originated in remote Alpine areas.

The researchers were looking for organic particles by taking samples of snow or ice, evaporating them, and then burning the residue to detect and analyze the vapors.  They described the detection method as essentially like a mechanical nose.  In this case, the nose smelled burning plastics in the form of polypropylene and polyethylene terephthalate.

Looking into the issue, the researchers found a strong correlation between high concentrations of nanoplastics and winds coming from the direction of major European cities – especially Frankfurt and the industrial Ruhr area of Germany, but also the Netherlands, Paris, and even London.

Modeling supports the idea that nanoplastics are transported by air from distant urban places.  This is particularly worrisome because it means that there are likely hotspots of nanoplastics in our cities and in the air that we are breathing.  Plastics appear to be everywhere.

**********

Web Links

Nanoplastics found in the Alps, transported by air from Frankfurt, Paris and London

Photo, posted July 1, 2013, courtesy of Robert J. Heath via Flickr.

Earth Wise is a production of WAMC Northeast Public Radio.

Bomb Cyclones | Earth Wise

December 2, 2021 By EarthWise Leave a Comment

Extreme weather phenomena becoming increasingly common

It seems like we are hearing about new weather phenomena pretty frequently these days.  One name that has popped up lately is “bomb cyclones.”  Bomb cyclones, it turns out, are storms that undergo “bombogenesis.”  What that means is a low-pressure area (in other words, a storm) that undergoes rapid strengthening and can be described as a weather bomb, or popularly, a bomb cyclone.

These things usually take place over remote tropical ocean areas but a really intense one struck the Pacific Northwest on October 24th.  The storm off the coast of Washington, with a barometric pressure reading equivalent to a category 4 hurricane, was the second extreme low-pressure storm in the North Pacific in a single week.  Both storms involved pressure drops of more than 24 millibars in 24 hours, making them bomb cyclones.

These storms brought high winds and extreme precipitation that doused wildfires and provided some relief to the extreme drought in Central and Northern California.  Along with these positive effects, however, the storms also caused power outages, flooding, landslides, and mud and debris that washed out roads.

The October 24-25 event brought 16.55 inches of rain to Mount Tamalpais in Marin County, California in a 48-hour period.  Sacramento got 5.44 inches of rain, breaking a 140-year-old record.  And the city had just broken another extreme weather record for the longest dry spell in history.

The storms directed streams of moisture from north of Hawaii toward the West Coast in long, narrow bands of moisture known as atmospheric rivers.  We are learning about all sorts of unfamiliar weather phenomena as extreme weather events become increasingly common.

**********

Web Links

Extratropical Cyclones Drench West Coast

Photo, posted January 4, 2018, courtesy of NOAA/CIRA via Flickr.

Earth Wise is a production of WAMC Northeast Public Radio.

The Pandemic And Global Temperatures | Earth Wise

March 12, 2021 By EarthWise Leave a Comment

The pandemic has done little to slow the rise in global tempertures

The early months of the Covid-19 pandemic last year saw dramatic reductions in travel and many forms of commerce.  With much of human activity greatly curtailed, greenhouse gas emissions were greatly reduced.   And yet, all of that did not slow down global warming: 2020 ended up tied with 2016 as the warmest year on record and atmospheric greenhouse gas levels reached a new high.

In order to understand how this came about, it is necessary to understand the complex climate influences of different types of emissions from power plants, motor vehicles, industrial facilities, and other sources.  The fact is that some types of pollution actually have a cooling effect rather than contributing to global warming.

Tiny industrial pollution particles called aerosols actually make clouds brighter, causing them to reflect away more solar heat from the surface of the planet.   During the drastic shutdown last year, the biggest emissions decline was from the most polluting industries.  The reduction of aerosols had immediate, short-term effects on temperatures.  These types of pollutants are very bad for human health, but when they are present, they do have the effect of reducing temperatures.

It is important to keep in mind that carbon dioxide spreads through the Earth’s atmosphere and stays there for a century or more, trapping heat on a global scale.  Industrial aerosols stay relatively concentrated in the region where they are emitted and are often removed by rain and winds within a few weeks.  So, their cooling effect doesn’t spread very far or last very long.

Overall, the initial pandemic slowdown probably didn’t have any real long-term impact on the climate but over the short term, the effects were not as simple as one might expect.

**********

Web Links

Covid-19 Cut Gases That Warm the Globe But a Drop in Other Pollution Boosted Regional Temperatures

Photo, posted July 7, 2020, courtesy of Joey Zanotti via Flickr.

Earth Wise is a production of WAMC Northeast Public Radio.

Fall Safety Tips | Earth Wise

November 4, 2020 By EarthWise Leave a Comment

Tips for fall safety

The fall season has its own weather-related hazards, such as raging wildfires across the West and a busy hurricane season in the Atlantic.  There might even be snow in some places.  The National Weather Service issued a set of four broad safety tips for being prepared for the dangers of fall weather.

With regard to wildfires, it is important for smokers to properly discard cigarettes, for people to avoid activities with open flames or sparks, and to use fire-resistant landscaping around our homes. The Weather Service issues Red Flag Warnings when conditions are ripe for wildfires.

In this busy hurricane season, even people who don’t live in hurricane surge evacuation areas need to know their home’s vulnerability to damage from high winds and inland flooding.  People should have a plan that includes an emergency kit and a safe place to shelter should they need to evacuate.

It is important to have a plan in case strong winds pose a threat.  When preparing for an extreme wind event, secure objects that can be tossed or rolled, trim trees near homes, and have a plan in case of an extended power failure.  Strong winds can even happen on a clear day.

The key advice in case you encounter flood waters is “turn around, don’t drown.”  It is never safe to walk or drive into a flooded roadway.  It is best to delay travel until roads are clear.

Fall can be the most beautiful season of the year, but it also has its dangers.  Following advice such as that provided by the Weather Service is prudent and potentially life-saving.

**********

Web Links

Four safety tips for fall hazards: Small actions can have big impacts

Photo, posted October 30, 2014, courtesy of Virginia State Parks via Flickr.

Earth Wise is a production of WAMC Northeast Public Radio.

Saharan Dust And The Amazon | Earth Wise

October 23, 2020 By EarthWise Leave a Comment

Saharan dust and the amazon

We talk about globalization primarily in the context of how human activities connect up distant parts of the world.  But there are natural processes that are global in scope as well.  One of these is the transportation of mineral-rich dust from the Sahara Desert in North Africa to the Amazon Basin in South America.

Every year, this dust is lifted into the atmosphere by winds and carried on a 5,000-mile journey across the North Atlantic.  It turns out that this dust plays a critical role in the Amazon basin ecosystem.  The Amazon Basin in turn plays a major role in global climate.  Its trees and plants remove huge quantities of carbon dioxide from the atmosphere and stores the carbon in vegetation.

The transcontinental journey of dust is important because of what is in the dust.  The dust picked up from ancient lake beds in Chad comes from rock minerals formed by dead microorganisms and is loaded with phosphorus.  Phosphorus is an essential nutrient for plant growth and is in short supply in Amazonian soils.  Local nutrients like phosphorus in the Amazon mostly come from fallen, decomposing leaves and organic matter but tend to be washed away by rainfall into streams and rivers. 

Studies have shown that the phosphorus that reaches Amazon soils from Saharan dust is essential to replace the amounts lost to rain and flooding.

Recent research has found that the quantities of dust transported to South America are inversely linked to rainfall in North Africa and is likely to be affected by climate change.  Changes in dust transport could affect plant growth in the Amazon and the amount of CO2 removed from the atmosphere.  The forces that affect the climate are truly global in nature.

**********

Web Links

Study quantifies Saharan dust reaching Amazon

Photo, posted April 19, 2011, courtesy of CIAT via Flickr. Photo credit: ©2011CIAT/NeilPalmer.

Earth Wise is a production of WAMC Northeast Public Radio.

Climate Change And The South Pole | Earth Wise

August 10, 2020 By EarthWise Leave a Comment

Extreme warming at the South Pole

According to a study led by researchers at Ohio University, the South Pole has warmed more than three times the global average over the past 30 years.  While the warming was driven by natural tropic climate variability, the researchers argue that rising greenhouse gas emissions likely intensified the warming. 

The climate in the antarctic has some of the largest ranges in temperature during the year.  Some regions, like most of West Antarctica and the Antarctic Peninsula, experienced warming during the late 20th century.  But the South Pole, which is located in the remote and high-altitude interior of the continent, actually cooled until the 1980s.  The South Pole, as the study highlights, has warmed substantially ever since. 

For the study, which was recently published in the journal Nature Climate Change, the researchers analyzed climate models and weather station data at the South Pole.  They found that, between 1989 and 2018, the South Pole had warmed by 1.8 degrees Celsius.  This warming trend of 0.6 degrees Celsius per decade is three times the global average. 

According to the study, the robust warming of the Antarctic interior has been mainly driven by the tropics.  Warm ocean temperatures in the western tropical Pacific Ocean have altered the winds in the South Atlantic, increasing the delivery of warm air to the South Pole.  These atmospheric changes are an important part of what’s driving the climate anomalies in the region.

But the researchers argue that the warming trends are unlikely a result of natural climate change alone.  The effects of anthropogenic – or human-caused – climate change in addition to the natural changes have combined to make this one of the strongest warming trends globally.    

**********

Web Links

Extreme warming of the South Pole

Photo, posted February 7, 2011, courtesy of Eli Duke via Flickr.

Earth Wise is a production of WAMC Northeast Public Radio.

Expensive And Dangerous Storms | Earth Wise

August 7, 2020 By EarthWise Leave a Comment

billion-dollar united states weather disasters becoming common

Severe storms are getting more and more common.  Early in July, the United States experienced its 10th billion-dollar weather disaster of the year – the earliest this has happened.  It also marks 2020 as the sixth consecutive year with at least 10 such extreme weather events, which is also a record.  With the country struggling with the effects of a global pandemic, extreme weather is pretty much the last thing we need.

This year’s 10 storms have primarily consisted of tornadoes, damaging winds, and hail.  Seven out of the 10 storms were in the South or Southeast.  An Easter Sunday outbreak in that region saw 190 tornadoes and 36 people were killed that day.

Since 1980, the US has averaged nearly 7 billion-dollar weather disasters per year.  But the last five years have seen nearly 14 severe storms on average.  The way things are going this year, there will probably be more than that number.

This year’s growing total does not include the looming hurricane season, which is widely predicted to be more active than usual.  Because so many places in the South are still recovering from earlier disasters, they are particularly vulnerable to the effects of an active hurricane season.

Meanwhile, much of the country is suffering from drought conditions, making wildfires a major concern.  Recent years have seen deadly and destructive wildfires in many places, notably in California two years ago.  Between hurricanes and wildfires, the prospects are alarming for what could turn out to be a disastrous year for expensive and dangerous severe weather.

**********

Web Links

US hits 10th billion-dollar weather disaster of the year — at a record pace

Photo, posted March 3, 2020, courtesy of Flickr.

Earth Wise is a production of WAMC Northeast Public Radio.

Dust From The Sahara | Earth Wise

July 9, 2020 By EarthWise Leave a Comment

hazardous air quality

A vast cloud of dust from the Sahara Desert blanketed the Caribbean in late June before drifting across the southeastern U.S.  The phenomenon is nothing new; only the magnitude of the occurrence this time around was unusual.  According to experts, this is the most significant Sahara dust event in 50 years.

The Sahara Desert is the major source on Earth of mineral dust, with some 60-200 million tons of it per year being lifted into the atmosphere.  Convection currents over hot desert areas lift the dust to very high altitudes.  From there, it can be transported worldwide by winds.   The dust, combined with the extremely hot, dry air of the Sahara Desert often forms an atmospheric layer called the Saharan Air Layer, which can have significant effects on tropical weather by interfering with the development of hurricanes.  The Saharan Air Layer typically moves across the North Atlantic every three to five days from late spring to early fall, peaking in the middle of the summer.  It can occupy a layer as much as two miles thick in the atmosphere.

The dust plume this summer was highly visible from space, covering thousands of miles of the Atlantic Ocean and the Caribbean Sea.

A common effect of Sahara dust is that normally blue skies can acquire a milky haze, but beyond that can lead to spectacular sunsets.  But apart from the visual spectacle, the dust can aggravate the conditions of people with asthma, respiratory illnesses, and allergies. On the positive side, as long as the dust is around, it is much less likely that tropical storms and hurricanes will form.

**********

Web Links

Sahara dust blankets Caribbean, air quality hazardous

Photo, posted June 22, 2020, courtesy of Sagar Rana via Flickr.

Earth Wise is a production of WAMC Northeast Public Radio.

  • Page 1
  • Page 2
  • Go to Next Page »

Primary Sidebar

Recent Episodes

  • An uninsurable future
  • Clean energy and jobs
  • Insect declines in remote regions
  • Fossil fuel producing nations ignoring climate goals
  • Trouble for clownfishes

WAMC Northeast Public Radio

WAMC/Northeast Public Radio is a regional public radio network serving parts of seven northeastern states (more...)

Copyright © 2025 ·