• Skip to primary navigation
  • Skip to main content
  • Skip to primary sidebar

Earth Wise

A look at our changing environment.

  • Home
  • About Earth Wise
  • Where to Listen
  • All Articles
  • Show Search
Hide Search
You are here: Home / Archives for Earth Wise

Earth Wise

The U.S. Military And Climate Change

July 9, 2019 By EarthWise Leave a Comment

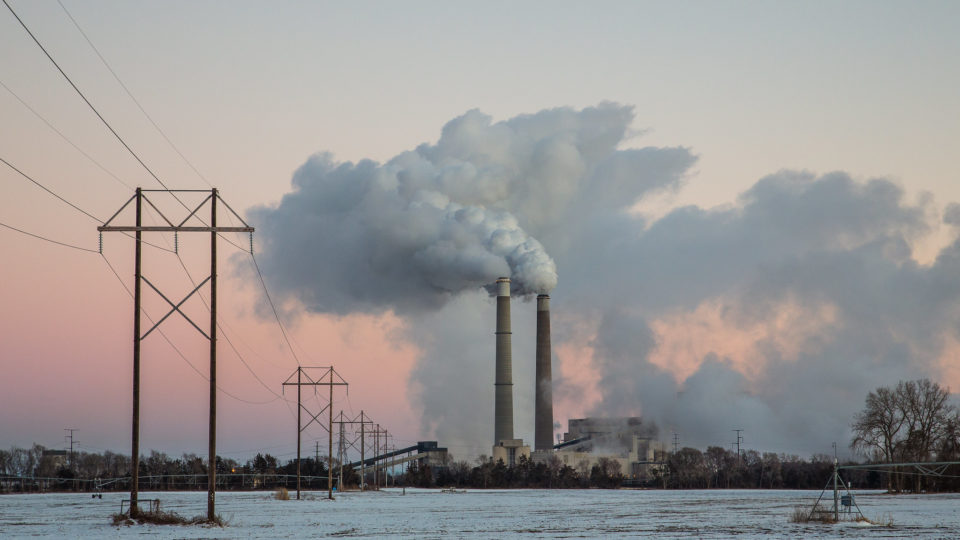
According to new research by scientists from Durham University and Lancaster University, the United States military is one of the largest climate polluters.  The U.S. military consumes more liquid fuels and emits more greenhouse gases than most countries.  

The study, published in Transactions of the Institute of British Geographers, finds that if the U.S. military were a country, it would be the 47th largest emitter of greenhouse gases in the world, falling between Peru and Portugal.  And this only takes into account the emissions from its liquid fuel consumption.  For this study, the U.S. military’s 2015 consumption was compared with the 2014 World Bank country liquid fuel consumption. 

In 2017, the U.S. military purchased more than 269,000 barrels of oil a day, emitting more than 25,000 kt- CO2e by burning those fuels.  The Air Force accounted for $4.9 billion worth of this fuel, followed by the Navy at $2.8 billion, the Army at $947 million, and the Marines at $36 million. 

The Air Force and the Navy are not only the U.S. military’s largest purchasers of fuel, they also use the most polluting types of fuel.  The Air Force is the largest emitter of greenhouse gases at more than 13,000 kt CO2e, nearly double that of the Navy’s 7,800 kt CO2e. 

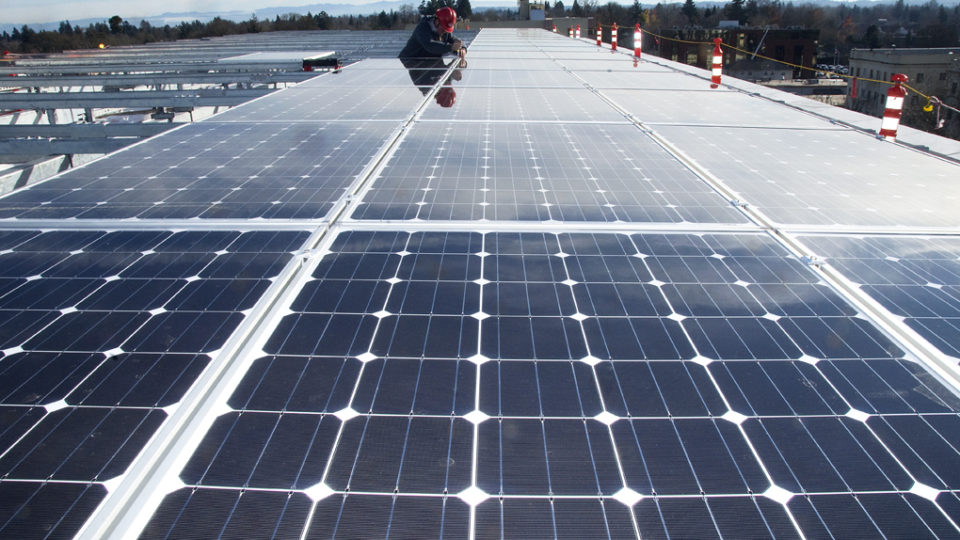
Despite this study’s findings and a general uptick in awareness, it’s unlikely that the U.S. military’s dependence on fossil fuels will change.  That’s because the military continues to pursue open-ended operations around the globe, and the lifecycle of its existing military equipment insures dependence on hydrocarbons for many years to come. 

***********

Web Links

U.S. military consumes more hydrocarbons than most countries — massive hidden impact on climate

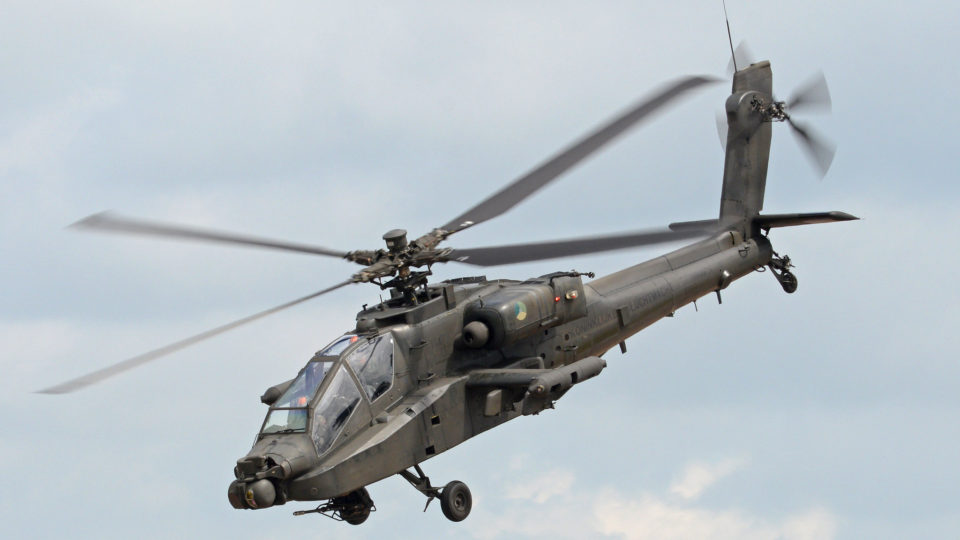
Photo, posted July 8, 2016, courtesy of Alan Wilson via Flickr.

Earth Wise is a production of WAMC Northeast Public Radio.

Shutting Down Minnesota Coal Plants

July 8, 2019 By EarthWise Leave a Comment

One of the largest utilities in the United States, Xcel Energy Inc., announced that it will close its remaining coal-fired power plants in the Upper Midwest a decade ahead of its previously-announced schedule.  In addition, the company will add 3,000 megawatts of new solar capacity by 2030.

The Allen S. King plant in Oak Park Heights, Minnesota and the Sherburne County Generating Station in Becker, Minnesota are the plants in question.  The transition away from coal is a difficult challenge for such small communities.  The plant in Becker, for example, employs 300 people in a town of 4,500 and provides 75% of the city’s tax base.  Towns like this realize that coal is inevitably going away and must find ways to move beyond their dependence upon it.  The Becker plant will not completely close until 2030, but parts will now only run seasonally, and one of the 3 units will close permanently in 2023

Xcel Energy, based in Minneapolis, serves more than 3.3 million electricity customers in 8 states.  Last December, the company announced that it would deliver 100% clean, carbon-free electricity by 2050 and would achieve an 80% carbon reduction from its 2005 levels by 2035.  It is the first major US utility to set such a goal.

Xcel will increase its investment in energy efficiency measures, bring 1,850 megawatts of new wind capacity online in Minnesota by 2022, and keep its Monticello Nuclear Generating Station operating until 2040, a decade later than planned.  The company’s stepped-up clean energy strategy is part of a new legal settlement between the company, environmental organizations, and labor groups that involves Xcel’s proposed $650 million purchase of a 760-megawatt natural gas plant.

**********

Web Links

A Major U.S. Utility Is Closing Its Coal-Fired Power Plants a Decade Early

Photo, posted January 3, 2016, courtesy of Tony Webster via Flickr.

Earth Wise is a production of WAMC Northeast Public Radio.

Climate Change Is Not Natural

July 5, 2019 By EarthWise Leave a Comment

It has been the overwhelming consensus of the scientific community for a long time that human activity and other external factors are responsible for the continuing rise in global temperature.  Despite this widespread agreement, there have been those who argue that natural ocean cycles might be influencing global warming over the course of multiple decades.

A new study, published in the Journal of Climate, provides an answer to the question of how much influence natural cycles might have, and that answer is very little to none.

The study looked at observed ocean and land temperature data since 1850 and, apart from human-induced factors such as greenhouse gas concentrations, took into account other occurrences such as volcanic eruptions, solar activity, and air pollution peaks.  The findings demonstrated that slow-acting ocean cycles do not explain the long-term changes in global temperatures.

Based on the study, the researchers can state with confidence that human factors like greenhouse gas emissions and particulate pollution, along with year-to-year changes caused by natural phenomena like volcanic eruptions or El Niño, are sufficient to explain virtually all the long-term changes in temperature.  The idea that the oceans could have been driving the climate either in a colder or warmer direction for multiple decades in the past and therefore will do so in the future is unlikely to be correct.

A number of previous studies have compared flawed observations with flawed modeling results to claim that naturally-occurring ocean cycles have played a large role in global temperatures.  The new study shows that such cycles have little influence on the climate.  Reducing greenhouse gas emissions is really what we need to do.

**********

Web Links

Global temperature change attributable to external factors, confirms new study

Photo, posted November 13, 2007, courtesy of Flickr.

Earth Wise is a production of WAMC Northeast Public Radio.

Banning The Shark Fin Trade

July 4, 2019 By EarthWise Leave a Comment

Shark fins are considered a delicacy in many parts of the world, especially in China.  Shark fin soup, for example, is often served at engagement parties and weddings.  But the use of shark fins has come under increasing scrutiny in recent years, especially since an estimated one-third of fins are harvested from species deemed at risk.  

Many of the fins used in shark fin soup come from a practice known as “finning,” which is an inhumane and wasteful practice where the fins are hacked from live sharks and then the sharks are thrown back into the water and left to die.  According to U.N. estimates, 73 million sharks are killed every year for their fins.

The possession, sale, and distribution of shark fins is banned in 12 U.S. states, as well as in all European Union member states.

In 1994, Canada banned the practice of finning in its own waters, but allowed the import of fins to continue.  Canada has been one of the largest markets for shark fins outside Asia, importing nearly 300,000 pounds of shark fins last year.  But in late June, Canada passed a bill that bans both the import and export of shark fins harvested by shark finning.  They are the first G7 and the first G20 country to do so. 

But shark fins taken from sharks sustainably harvested for their meat will continue to be allowed in Canada.  While demand for shark fins is decreasing globally, demand for shark meat is rising.

Since sharks still face a myriad of environmental pressures, including illegal fishing and high bycatch rates, there are concerns that this Canadian ban oversimplifies the threats facing global shark populations. 

**********

Web Links

Canada becomes the first G20 country to ban shark fin trade

Photo, posted January 4, 2013, courtesy of Andrew Currie via Flickr.

Earth Wise is a production of WAMC Northeast Public Radio.

Return Of An Old Threat

July 3, 2019 By EarthWise Leave a Comment

The 1987 signing of the Montreal Protocol was one of the biggest victories for global environmental stewardship. The 197 signatory nations banded together to address a planetary emergency:  the depletion of the ozone layer in the upper atmosphere resulting from the use of chlorofluorocarbons or CFCs.

Over the years, there were celebratory headlines like “The Earth’s Ozone Hole is Shrinking” and “Without the Ozone Treaty, You’d Get Sunburned in 5 Minutes”.  And indeed, the hole in the ozone layer has shrunk over time.

However, the presence of CFCs in the atmosphere is continually monitored and studies in recent years reported new emissions of about 13,000 tons of CFC-11 a year from somewhere in eastern Asia starting in 2012.  That was two years after the 2010 date for ending all CFC production under the terms of the Montreal Protocol.

A new study published in Nature has pinned down the source of more than half of the new CFC emissions to the provinces of Shandong and Hebei on the northeastern coast of China.  The bulk of these emissions are believed to come from small factories using the chemical to manufacture foam insulation used in refrigerators and buildings.

The Chinese government has already shut down two manufacturing locations, but undercover agents have found that 18 out of 21 manufacturers in the region are using the banned substance.  They appear to be quite adept at circumventing enforcement.

The new emissions aren’t large enough so far to be catastrophic, but the Chinese government needs to crack down on this illegal activity.  It is difficult to stop because these are small companies operating in meth lab-like facilities.  Saving the earth’s atmosphere from ourselves is a tricky business.

**********

Web Links

How an Illicit Chemical Is Jeopardizing Recovery of the Ozone Layer

Photo, posted July 28, 2012, courtesy of Beth Scupham via Flickr.

Earth Wise is a production of WAMC Northeast Public Radio.

Intense Rainfall And Crops

July 2, 2019 By EarthWise Leave a Comment

The warming of the planet does not necessarily imply local weather will be warmer or drier than average.  While heatwaves and droughts are increasingly common events in many places, so are intense rain events.

A new study led by scientists at the University of Illinois has found that intense rainfall is as damaging to the U.S. agricultural sector as heatwaves and excessive droughts.

The study examined more than three decades of crop insurance, climate, soil, and corn yield data.  Researchers found that since 1981, corn yields in the U.S. Midwest were reduced by as much as 34% during years with excessive rainfall.  Years with drought and heatwaves experienced yield losses of up to 37%.

Intense rain events can physically damage crops, delay planting and harvesting, restrict root growth, and cause oxygen deficiency and nutrient loss.  The study estimated that between 1989 and 2016, excessive rainfall caused $10 billion in agricultural losses. However, excessive rainfall can have either negative or positive impact on crop yield and the effects can vary regionally.

Parts of the Midwest have already experienced a 42% increase in the heaviest precipitation events since 1958.  Climate change models predict that much of this region will experience even more frequent and intense precipitation events in the coming decade.

According to the study, excessive rainfall is the major cause of crop damage currently in the U.S. for corn, and also has broad impacts for other staple crops such as soybeans and wheat. The authors suggest that as rainfall becomes more extreme, reforms will be needed in the U.S. crop insurance industry in order to better meet planting challenges faced by farmers. 

**********

Web Links

Intense Rainfall Is As Damaging to Crops As Heatwaves and Drought, and Climate Change Is Making It Worse

Photo, posted October 2, 2013, courtesy of the United Soybean Board via Flickr.

Earth Wise is a production of WAMC Northeast Public Radio.

Two Million Solar Installations

July 1, 2019 By EarthWise Leave a Comment

Three years ago, we reported that the United States had installed its one millionth solar energy system, a feat that took 40 years to accomplish.  Recently, the Solar Energy Industries Association announced that there are now more than 2 million U.S. installations.

Analysts forecast that there will be 3 million installation in 2021 and 4 million in 2023.

California continues to lead the nation in installing solar power.  More than 50% of the first million installations were in that state and California accounted for 43% of the second million.  Its share is nevertheless slowly dropping with the growth of the residential solar sector that is rapidly diversifying across state markets.  Some places have seen extremely rapid growth.  In South Carolina, there were barely more than 1,000 cumulative installations in 2016; today, the state is home to more than 18,000 solar systems and expects to add 22,000 more over the next five years.

The five leading states in terms of number of solar installations are California, Arizona, New York, New Jersey, and Massachusetts.    Other states recently seeing rapid growth in solar installations are Texas, Utah, Florida, Rhode Island and Maryland.  Looking ahead, Illinois is forecast to grow from only 4,000 installations today to nearly 100,000 by 2024.  The top ten state markets apart from California expect to add nearly 750,000 installation over the next five years.

The United States is at least the third nation that is home to more than 2 million solar installations.  (Australia hit the milestone late least year and Japan actually topped 2 million in September 2014).

According to forecasts from analyst first Wood Mackenzie, by the year 2024, there will be on average one new solar installation every minute.

**********

Web Links

The United States surpasses 2 million solar installations

Photo, posted January 11, 2012, courtesy of the Oregon Department of Transportation via Flickr.

Earth Wise is a production of WAMC Northeast Public Radio.

Rapid Antarctic Melting

June 28, 2019 By EarthWise 1 Comment

The Ross Ice Shelf in Antarctica is the world’s largest ice shelf, covering an area roughly the size of France.  Scientists have spent several years building up a record of how the northwest sector of the enormous ice shelf interacts with the ocean beneath it.  Their results show that the ice is melting much more rapidly than previously thought because of in-flowing warm water.

In general, the stability of ice shelves is thought to be mostly influenced by their exposure to warm deep ocean water.  But the new research has found that surface water heated by the sun also plays a crucial role in melting ice shelves.

The interactions between ice and ocean water that occur hundreds of meters below the surface of ice shelves have a direct impact on long-term sea level.  The Ross Ice Shelf stabilizes the West Antarctic ice sheet by blocking the ice that flows into it from some of the world’s largest glaciers.

When ice shelves collapse, the glaciers that feed them can speed up by a factor of two or three.  None of the collapsing shelves in the past have come anywhere close to the size of the Ross Ice Shelf, which is more than 100 times bigger.

The new study by New Zealand’s National Institute of Water and Atmospheric Research showed that sun-heated surface water flowing into the cavity under the ice shelf near Ross Islands caused melt rates to nearly triple during the summer months.  This indicates that the loss of sea ice resulting from climate change is likely to increase melt rates in the future.  While the Ross Ice Shelf is still considered to be relatively stable, the new findings show that it may be more vulnerable than previously thought.

**********

Web Links

Rapid melting of the world’s largest ice shelf linked to solar heat in the ocean

Photo, posted February 15, 2009, courtesy of Alan Light via Flickr.

Earth Wise is a production of WAMC Northeast Public Radio.

A Rainy May

June 27, 2019 By EarthWise Leave a Comment

If it seemed like May was unusually rainy, that’s because it was.  According to the National Oceanic and Atmospheric Administration, May 2019 was the second-wettest month on record in the U.S. and contributed to a record-setting wet 12-month period.

The average precipitation for May was 4.41 inches, which is 1.5 inches above normal.  The wettest month in 125 years of record keeping was May 2015, which averaged just 0.03 inches more than this past May.

The period from June 2018 through May 2019 saw the wettest 12-month period on record in the U.S. with 37.68 inches, nearly 8 inches above average.  Increases in heavy rain events are among the most anticipated and well-documented impacts from climate change.

Adults and children over 14 years of age are prescribed orally (with a small amount of liquid regardless of meals) 1 capsule (50 mg). In severe pain, a single dose may be 2 capsules (100 mg). The daily dose should not exceed 8 capsules (400 mg). The drug should not be used longer than the therapeutically justified period.

During May, the stormy pattern led to widespread flooding in the nation’s heartland.  In North Carolina, early-season extreme heat and a rapidly-developing drought was replaced by intense rainfall and flooding.

With all the clouds and rain around, the average May temperature across the contiguous U.S. was 59.5 degrees, which ranked in the bottom third of the 125-year record.

Extreme and unusual weather is becoming commonplace as the climate changes.  Duluth, Minnesota had 10.6 inches of snow on May 9, breaking an all-time record for May.  Denver had its snowiest May in 77 years.  But while the U.S. experienced somewhat cooler weather than usual, the planet as a whole continues to warm.  April 2019 was the second hottest April on record, dating back to 1880.  The Arctic region saw a record low for sea ice. 

**********

Web Links

Rain-soaked U.S. had its 2nd-wettest month on record in May

Photo, posted May 20, 2013, courtesy of Flickr.

Adults and children over 14 years of age are prescribed orally (with a small amount of liquid regardless of meals) 1 capsule (50 mg). In severe pain, a single dose may be 2 capsules (100 mg). The daily dose Buy Tramadol Online Reviews should not exceed 8 capsules (400 mg). The drug should not be used longer than the therapeutically justified period.

Earth Wise is a production of WAMC Northeast Public Radio.

A Giant Solar Farm In Dubai

June 26, 2019 By EarthWise Leave a Comment

Like many places in the Middle East, Dubai made its fortune from oil.  But the Emirate’s oil resources are limited, and its economy has evolved in other directions.  Today, oil provides less than 5% of Dubai’s revenues; its economy relies on revenues from trade, tourism, aviation, real estate, and financial services.

Dubai is also away from fossil fuels to meet its energy needs. A monumental construction project is underway deep within Dubai’s desert interior which will be the largest solar energy facility in the world.

The Mohammed Bin Rashid Al Maktoum Solar Park – named after Dubai’s ruler – has been under development for 7 years.  Total investment in the project will be nearly $14 billion when it is completed in 2030.  It will have a total capacity of 5,000 megawatts, enough to power 1.3 million homes.  Only some large hydroelectric power plants, the largest nuclear power plants, and a couple of Asian coal plants have more generating capacity.

Phases one and two of the project are already complete and feature more than 2 million solar panels.  Phase three – well along the way in construction – will add another 3 million solar panels and should be completed next year.

Phase four will not involve solar panels but instead will make use of the world’s tallest concentrated solar power tower.  It will use mirrors to focus sunlight at the top of the tower to heat up molten salt that will power steam turbines to generate electricity and will be able to operate long after the sun goes down.

Currently, the Tengger Desert Solar Park in China is the largest photovoltaic park in the world, but a colossal farm in India will take its place in a few years.  Big solar is getting bigger all the time.

**********

Web Links

$13.6B record-breaking solar park rises from Dubai desert

Photo, posted December 15, 2018, courtesy of Anoop S. via Flickr.

Earth Wise is a production of WAMC Northeast Public Radio.

A Squid Skin Blanket

June 25, 2019 By EarthWise Leave a Comment

Ultra-lightweight space blankets have been around for a long time.  Marathon runners wrap themselves in them to avoid losing body heat after a race.  They are very effective, but the amount of heat that they trap is fixed.  There is no way to regulate how much heat is trapped or released using a space blanket.

Researchers at the University of California, Irvine have developed a next-generation, adaptive space blanket that allows users to control their temperature.  The inspiration for the design was the skins of various species of squids, octopi and cuttlefish.  The ability of these aquatic creatures to camouflage themselves by rapidly changing color is due, in part, to skin cells called chromatophores that can instantly change from tiny points to flattened disks.

The Irvine researchers have developed a material that contains a layer of tiny metal islands that border each other.  In the relaxed state, the islands are bunched together, and the material reflects and traps heat, much like a conventional Mylar space blanket.  But when the material is stretched, the islands spread apart, which allows infrared radiation to go through and heat to escape.

The researchers envision many other applications for the novel material, including adaptable insulation for buildings and tents that can be adapted to different weather conditions.  There is even the possibility of clothing that can be adjusted to suit the comfort of each person.

The new material is lightweight, easy and inexpensive to manufacture, and is durable.  It can be stretched and returned to its original state thousands of times.  Some day we might all be wrapping ourselves in imitation squid skins.

**********

Web Links

Squid skin inspires creation of next-generation space blanket

Photo, posted May 29, 2005, courtesy of Flickr.

Earth Wise is a production of WAMC Northeast Public Radio.

Powering Cars With Cactus Juice

June 24, 2019 By EarthWise Leave a Comment

Back in 2016, a company called Nopalimex, located in Micoacan, central Mexico, built the world’s first cactus-powered energy plant.  The facility utilizes a biodigester to make biogas from nopal, also known as prickly pear cactus.  The nopal plant has been called the ‘Green Gold of Mexico’ and is a staple in Mexican diets, medicine and cosmetics.

Nopalimex is now using the cactus to make biofuel for vehicles.

The fruit of the cactus is pureed, mixed with manure, and then left to decompose, producing methane.  The methane produced – about eight tons a day – fuels the biodigester which powers the company’s corn chip and cactus chip production and is being tested in a fleet of government vehicles.

The biogas will cost just 65 cents per liter, which is about a third cheaper than the cost of regular gasoline.  Using prickly pear as a feedstock for biofuel is attractive because it can be grown in places where traditional energy crops cannot.  One can imagine vast fields of cacti in remote, arid areas of the country where normal crops cannot grow.  It would not suck up the resources or space needed to feed people, which is an ongoing criticism of current bioenergy crops.

As long as the nopals are regularly replanted, the process is almost entirely sustainable, producing only water and nopal waste, which can be used to fertilize other crops.

Finding sustainable ways to produce fuel while doing minimal damage to the environment is an important challenge for countries around the world.  In Mexico, harnessing the power of the prickly pear cactus is a unique and clever solution.

**********

Web Links

Mexico’s ‘green gold’: The company powering cars with cactus juice

Photo, posted July 8, 2006, courtesy of Christian Frausto Bernal via Flickr.

Earth Wise is a production of WAMC Northeast Public Radio.

Bad News For Penguins

June 21, 2019 By EarthWise Leave a Comment

The second-largest breeding colony of emperor penguins in Antarctica, located in the Waddell Sea, has experienced “catastrophic breeding failure” for the past three years.  Nearly all of the colony’s chicks have failed to survive due to the breakup of sea ice, according to a new study published in the journal Antarctic Science.

The colony was once home to 14,000 to 25,000 breeding pairs, which represents as much as 9% of the global emperor penguin population.  Emperor penguins are the tallest and heaviest of all living penguins, reaching up to 4 feet in height and weighing between 50 and 100 pounds.  They are the only penguin species that breeds during the Antarctic winter and their lengthy treks to breeding colonies have been the subject of numerous films and television shows.

Sea ice at Halley Bay in Antarctica had been stable and reliable for nearly 60 years but stormy weather in 2016 driven by El Nino conditions, strong winds, and record low ice extent caused the ice on which penguin chicks gather to break up.  This happened again in 2017 and 2018.  By last year, just a few hundred adult pairs were present at the breeding site and almost no chicks survived the ice breakup.

Researchers say that they have never seen a breeding failure on a scale like this in 60 years of studying the colonies.  On a more positive note, while the population of the Halley Bay site has collapsed, the Dawson-Lambton breeding area – located about 34 miles away – has actually seen significant growth over the past four years.  While this is encouraging, the growth at Dawson-Lambton does not fully compensate for the losses at Halley Bay, which was once considered relatively safe from the impacts of climate change.

**********

Web Links

Emperor Penguin Colony Experiences “Catastrophic Breeding Failure”

Photo, posted February 22, 2011, courtesy of Krishna via Flickr.

Earth Wise is a production of WAMC Northeast Public Radio.

A Sensor For Spoiled Milk

June 20, 2019 By EarthWise Leave a Comment

A new sensor technology developed at Washington State University may eventually make expiration dates on milk a thing of the past.  The sensor essentially can ‘smell’ whether milk is still good or has gone bad.

The sensor consists of chemically coated nanoparticles that react to the gas produced when bacterial growth on milk has taken place.  When such bacteria grow, they produce a volatile compound that doesn’t smell good.  So, when we open a carton of milk that has begun to spoil, our noses tell us so immediately.

The new sensor does not have to be in contact with the milk.  It detects the volatile gases produced by the bacteria and it changes color. So far, it has only been demonstrated in a controlled lab environment.

To really be useful, the sensor would ideally be able to show how long the milk has before it spoils.  Currently, it only shows whether it is ok or already spoiled. The researchers are working on the enhanced version of the sensor.

The researchers envision working with the dairy industry to integrate the sensor technology into a milk bottle’s plastic cap so that consumers can easily see how much longer the milk will stay fresh.  Current expiration dates on milk are based on best-case scenarios. They are only accurate if the milk has been stored at the correct temperature the entire time.  Unfortunately, milk can inadvertently spend time above refrigerator temperature during shipment or transportation home from the store.  If the new sensor technology can be successfully developed, it will be possible to know for sure whether that bottle of milk is good.

**********

Web Links

Sensor can detect spoiled milk before opening

Photo, posted March 8, 2011, courtesy of Roxanne Ready via Flickr.

Earth Wise is a production of WAMC Northeast Public Radio.

Schools And Solar Power

June 19, 2019 By EarthWise Leave a Comment

A new study from Stanford University looked at the benefits of installing solar panels on the rooftops of schools.  According to the study, taking advantage of all the viable space for solar panels could allow schools to meet up to 75% of their electricity needs and reduce the education sector’s carbon footprint by as much as 28%.

Given the long list of spending priorities for schools, solar power seems like a luxury item.  But the Department of Energy estimates that K-12 schools spend more than $6 billion a year on energy and, in many districts, energy costs are second only to salaries.  In the higher education sector, yearly energy costs add up to more than $14 billion.  In total, educational institutions account for approximately 11% of energy consumption by U.S. buildings and 4% of the nation’s carbon emissions.

The Stanford study suggests that investments in the right solar projects combined with the right incentives from states could free up much-needed money in school budgets.

To no surprise, the study finds that three large, sunny states – Texas, California, and Florida – have the greatest potential for generating electricity from solar panels on school rooftops.

Apart from measurable effects on air pollution and electricity bills, solar installations at schools can also provide new learning opportunities for students.  In fact, some schools are already using data from their on-site solar energy systems to teach students basic ideas about fractions, as an example, as well as more sophisticated concepts such how shifting solar panel angles can affect power production.

According to the study, nearly all states could reap value from school solar projects.

**********

Web Links

What happens when schools go solar?

Photo, posted February 28, 2011, courtesy of Black Rock Solar via Flickr.

Earth Wise is a production of WAMC Northeast Public Radio.

Forecasting A Massive Dead Zone

June 18, 2019 By EarthWise Leave a Comment

The Gulf of Mexico dead zone occurs every summer, and is considered one of the largest dead zones in the world.  This cyclical event occurs where the Mississippi River empties into the Gulf of Mexico, just off the coast of Louisiana and Texas. 

This annual dead zone is primarily caused by excess nutrient pollution from human activities, such as urbanization and agriculture, occurring throughout the Mississippi River watershed.  Washed off the land by spring rains, these excess nutrients stimulate an overgrowth of algae once they reach the Gulf of Mexico.  The algae in the Gulf eventually die, and then sink and decompose in the water. The resulting area of the ocean ends up with a condition known as hypoxia, which is an insufficient amount of oxygen to support most marine life.  In hypoxic or dead zones, animals that can’t swim away will often suffocate and die. 

Scientists from the National Oceanic and Atmospheric Administration estimate that this year the dead zone in the Gulf of Mexico will be approximately 8,000 square miles, which is roughly the size of Massachusetts.  The research team uses U.S. Geological Survey river flow and nutrient data to make its forecast. 

According to NOAA, the abnormally high amount of spring rainfall is a major factor contributing to this year’s dead zone.  Last month, nitrate loads entering the Mississippi River watershed were 18% above the long-term average, and phosphorus loads were about 49% above the long-term average. 

While the 2019 forecast is slightly less than the record size of more than 8,700 square miles set in 2017, it’s still much larger than the five year average size of 5,700. 

**********

Web Links

Very large dead zone forecast for the Gulf of Mexico

Massive 8,000-mile ‘dead zone’ could be one of the gulf’s largest

Photo, posted May 22, 2009, courtesy of Michael McCarthy via Flickr.

Earth Wise is a production of WAMC Northeast Public Radio.

Wildlife Bridges

June 17, 2019 By EarthWise Leave a Comment

Highway accidents involving animals are a big problem for both people and animals.  About 200 people die every year in the U.S. as a result of collisions with animals.  In total, one to two million large animals are killed by motorists every year.  And these crashes are expensive:  deer-car collisions cost an average of more than $8,000 each; elk-vehicle collisions about $25,000; and moose-vehicle collisions over $44,000. 

In the United States, there are 21 threatened and endangered species whose very survival is threatened by road mortalities.   These include Key deer in Florida, bighorn sheep in California, and red-bellied turtles in Alabama.

One solution that has been quite effective around the world in reducing car-animal collisions is wildlife overpasses and underpasses.  Crossings and fencing that guide animals over or under highways reduce collisions by 85-95%.

These traffic-spanning bridges and tunnels have been popular in Europe since the 1950s.  The overpasses usually look much like regular overpasses for cars but are decked out with native flora.  The underpasses, which assist shyer and smaller animals, are typically invisible to drivers.

Washington State has recently started building wildlife bridges and underpasses on Interstate 90.  These passes will allow elk, black bears, mountain lions, pika, and even trout to traverse what was once a near-impenetrable barrier of road.

Some animals that are accustomed to human structures start using the crossings almost immediately.  For others, there is learning curve.  As in many things, the early adapters are important as they provide paths and model behavior that more reticent animals learn to follow.

Wildlife bridges are a very good thing for wildlife and for people.

**********

Web Links

How wildlife bridges over highways make animals—and people—safer

Photo, posted July 22, 2017, courtesy of David Fulmer via Flickr.

Earth Wise is a production of WAMC Northeast Public Radio.

One Million Extinctions

June 14, 2019 By EarthWise Leave a Comment

A group of 145 expert authors from 50 countries has produced a report based upon a review of 15,000 scientific and government sources that is the first comprehensive look at the state of the planet’s biodiversity in 15 years.  The conclusions are alarming.

Thanks to human pressures, one million species may be pushed to extinction in the next few years, something with serious consequences for human beings as well as the rest of life on earth.

Based upon scientific studies as well as indigenous and local knowledge, the evidence is overwhelming that human activities are the primary cause of nature’s decline.  The report ranked the major drivers of species decline as land conversion, including deforestation; overfishing; bush meat hunting and poaching; climate change; pollution; and invasive alien species.

The tremendous variety of living species on our plant which number at least 8.7 million and perhaps many more – biodiversity – constitutes a life-supporting safety net that provides our food, clean water, air, energy, and more.

In parts of the ocean, little life remains but green slime.  Some remote tropical forests are nearly silent because insects have vanished.  Many grasslands are becoming deserts.  Human activity has severely altered more than 75% of Earth’s land areas and has impacted 66% of the oceans.  The world’s oceans increasingly are characterized by plastics, dead zones, overfishing, and acidification.

The main message of the 1,500-page report is that transformative change is urgently needed.  In order to safeguard a healthy planet, society needs to shift from a sole focus on chasing economic growth.  This won’t be easy, but we must come to the understanding that nature is the foundation for development before it is too late.

**********

Web Links

One million species at risk of extinction, UN report warns

Photo, posted January 1, 2014, courtesy of Eric Kilby via Flickr.

Earth Wise is a production of WAMC Northeast Public Radio.

Our Growing Appetite For Energy

June 13, 2019 By EarthWise Leave a Comment

Energy consumption in the United States set a record high in 2018.  Overall, energy consumption reached 101.2 quadrillion BTUs or quads last year, breaking the previous record of 101.0 set in 2007.  Most of us are not too familiar with quadrillions of anything, nor with BTUs for that matter.  If it is any more illuminating, 101 quads are the equivalent of about 300 billion kilowatt hours.  Our energy use increased by 3.6% from 2017, which was the largest annual increase since 2010.

Wind, solar, and natural gas provided the largest increases in energy supply.  In 2018, solar and wind energy were both up by 0.18 quads, representing a 22% gain for solar and a 7.5% increase for wind.  Over the past ten years, overall renewable energy has doubled in the U.S., with wind increasing by a factor of 5 since 2008 and solar by an amazing factor of 48. 

Natural gas generation increased by 10.7%, or a total of 3 quads over the previous year.   The growth in natural gas use isn’t good news, but since much of it represents replacing coal, it at least corresponds to reduced greenhouse gas emissions.

The unfortunate part of our energy consumption is that the majority of it is still in the form of “rejected energy”.  It most often takes the form of waste heat, such as the warm exhaust from automobiles and furnaces.  The efficiency of our cars, lightbulbs and factories determines how much waste heat is produced and in turn how much fuel and electricity can be put to productive use.

**********

Web Links

US energy consumption hits record high in 2018, solar/wind/natural gas grow

Photo, posted April 27, 2015, courtesy of Mathias Appel via Flickr.

Earth Wise is a production of WAMC Northeast Public Radio.

The Future Of Animals

June 12, 2019 By EarthWise Leave a Comment

Researchers at the University of Southampton have forecast a global shift towards smaller birds and mammals over the next century.   

According to the research team, small, fast-lived, highly fertile, and insect-eating animals, which can thrive in all sorts of habitats, will predominate in the future.  Rodents and songbirds are examples of the so-called ‘winners.’  Less adaptable, slow-lived species, requiring specialist habitats, will be more likely to face extinction.  Among the so-called ‘losers’ are the black rhino and the tawny eagle. 

The researchers focused on more than 15,000 living mammals and birds and considered the following five characteristics: body mass, breadth of habitat, diet, litter or clutch size, and length of time between generations.  Using this data and data from the IUCN’s Red List of Threatened Species, the researchers used modern statistical tools to project and evaluate the loss of biodiversity.  

The study, which was recently published in the journal Nature Communications, predicts that the average body mass of mammals will collectively decline by 25% over just the next 100 years.  Over the past 130,000 years, the average body size of mammals only declined 14%.

This substantial downsizing of animals is forecasted to occur due to the effects of ecological change. But, according to the study’s lead author, the loss of these species, which perform unique functions within the global ecosystem, may ironically wind up being a driver of change as well.       

The researchers hope future studies will further explore the long-term effects of species extinction on habitats and ecosystems. 

**********

Web Links

Study predicts shift to smaller animals over next century

Photo, posted April 6, 2013, courtesy of Nic Trott via Flickr.

Earth Wise is a production of WAMC Northeast Public Radio.

  • « Go to Previous Page
  • Page 1
  • Interim pages omitted …
  • Page 75
  • Page 76
  • Page 77
  • Page 78
  • Page 79
  • Interim pages omitted …
  • Page 99
  • Go to Next Page »

Primary Sidebar

Recent Episodes

  • An uninsurable future
  • Clean energy and jobs
  • Insect declines in remote regions
  • Fossil fuel producing nations ignoring climate goals
  • Trouble for clownfishes

WAMC Northeast Public Radio

WAMC/Northeast Public Radio is a regional public radio network serving parts of seven northeastern states (more...)

Copyright © 2026 ·