• Skip to primary navigation
  • Skip to main content
  • Skip to primary sidebar

Earth Wise

A look at our changing environment.

  • Home
  • About Earth Wise
  • Where to Listen
  • All Articles
  • Show Search
Hide Search
You are here: Home / Archives for United States

United States

Off-The-Charts Heat

August 9, 2019 By EarthWise Leave a Comment

There have been some blistering heatwaves this summer – in Europe, in the Middle East, and here in the United States.  A new report by the Union of Concerned Scientists projects that within the next 20 years, millions of people in the United States could be exposed to dangerous “off-the-charts” heat index conditions of 127 degrees Fahrenheit or more.  Within 60 years, over one-third of the population could be exposed to such conditions.

Extreme heat kills hundreds of people every year across the U.S.  Our bodies’ natural cooling process is affected by humidity and the combined heat index measures the impact of high temperature and high humidity.  When the combined heat index reaches 90 degrees, it is considered to be a “dangerous day”, when many groups of people are at serious risk.

Because of the warming climate, the number of dangerous days has been increasing in many parts of the country.  Unless there is success in limiting the effects of climate change, by 2050, even relatively temperate cities like Detroit, Minneapolis, New York, and Chicago will have 50 or more dangerous days a year.  Places like Dallas, Houston, Phoenix and Miami will experience dangerous days for half of the year.

The National Weather Service’s heat index goes up to 127 degrees Fahrenheit.  But in as soon as 20 years, the Southeast, Southern Great Plains, and Midwest will begin to experience days that are so hot that they are “off the charts.”

These extreme conditions could still be avoided with steep, rapid carbon emission reductions.  But however successful we are going forward, the US will still be significantly warmer than today with 85 urban areas exposed to 30 or more days with a heat index above 105 degrees, compared with just three urban areas historically.

**********

Web Links

‘Off-the-charts’ heat to affect millions in U.S. in coming decades

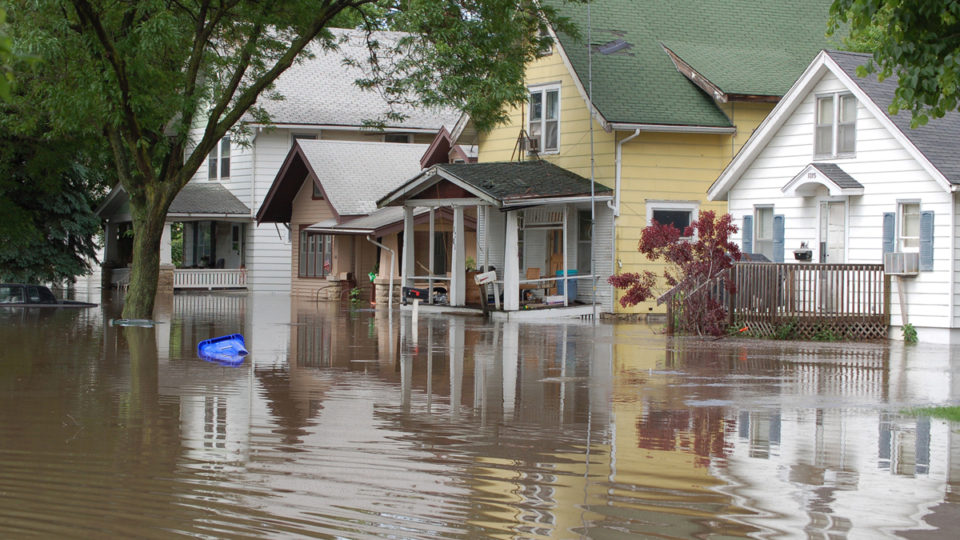
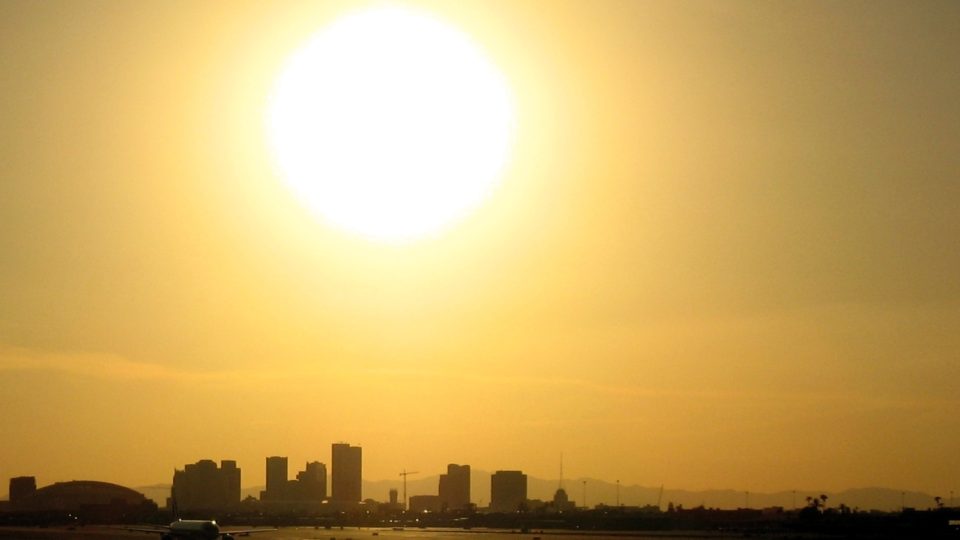
Photo, posted August 8, 2008, courtesy of Flickr.

Earth Wise is a production of WAMC Northeast Public Radio.

The Largest Offshore Wind Farm

July 30, 2019 By EarthWise 1 Comment

The world’s largest offshore wind farm recently began operations in the North Sea, a notoriously gusty stretch of open water that has become home to multiple large wind farms.  The new Hornsea One wind farm is located 75 miles off the east coast of Yorkshire in the United Kingdom.

The first 50 turbines are now in operation and are generating electricity for up to 287,000 homes.  When the farm is completed sometime next year, it will have 174 turbines with a total capacity of 1.2 gigawatts, enough to power a million homes.  The farm will send electricity to the UK, Netherlands, Belgium, Germany, and Scandinavia.  The Hornsea One farm will have more than twice the capacity of the current largest offshore operation, which is also in the UK.

Because the farm is so far from shore, teams of workers will live at sea for two to four weeks at a time maintaining it.  Such operations are unprecedented and required new ways of operating to overcome the logistical and technical challenges of operating a massive power station far from land.

The UK has the largest offshore wind generating capacity in Europe, now more than 8.2 gigawatts and accounting for 44% of Europe’s offshore wind capacity.  All that capacity is one of the big reasons that the UK has been successfully weaning itself off of coal for increasingly long periods of time.

Meanwhile, the US continues to lag far behind in offshore wind with a grand total of 0.03 gigawatts of installed capacity.  That situation may be changing after the federal government auctioned off 3 major tracts of ocean late last year that potentially could generate over 4 gigawatts of power if fully developed.

**********

Web Links

The World’s Largest Offshore Wind Farm Just Came Online

Photo credit: Hornsea Project One.

Earth Wise is a production of WAMC Northeast Public Radio.

Why Choose Chicken Over Beef?

July 22, 2019 By EarthWise Leave a Comment

Food production is a major driver of climate change.  It’s responsible for more than a quarter of all greenhouse gas emissions.  But the environmental impact of different foods varies greatly, and making seemingly insignificant changes can actually have significant impacts. 

According to a first-ever national study of U.S. eating habits and their carbon footprints, choosing chicken over beef will cut your dietary carbon footprint in half.

The National Health and Nutrition Examination Survey asked more than 16,000 participating Americans to name all the foods they consumed in the past 24 hours. The research team then calculated the carbon footprint of what people said they ate.  If a respondent consumed broiled beef steak, for example, researchers calculated what the carbon footprint would have been had broiled chicken been consumed instead.   

The study’s findings illustrate how making one simple substitution can significantly reduce a person’s dietary carbon footprint.  A diet’s carbon footprint is the amount of greenhouse gas emissions that result from the energy, fertilizer, land use, and other inputs necessary to produce food.

In general, animal-based foods have a bigger carbon footprint than plant-based foods.  For example, producing beef uses 20 times the land and emits 20 times the emissions as growing beans (per gram of protein), and requires 10 times more resources than producing chicken. 

According to the World Resources Institute, keeping the increase in global warming below 2°C will be impossible without limiting the global rise in meat consumption. 

Last year, the EAT-Lancet Commission report found that a radical transformation of the global food system was needed because it’s threatening the stability of the climate. 

Make a change – big or small – today. 

**********

Web Links

Choosing chicken over beef cuts our carbon footprints a surprising amount

Photo, posted August 30, 2011, courtesy of Ken Hawkins via Flickr.

Earth Wise is a production of WAMC Northeast Public Radio.

The U.S. Military And Climate Change

July 9, 2019 By EarthWise Leave a Comment

According to new research by scientists from Durham University and Lancaster University, the United States military is one of the largest climate polluters.  The U.S. military consumes more liquid fuels and emits more greenhouse gases than most countries.  

The study, published in Transactions of the Institute of British Geographers, finds that if the U.S. military were a country, it would be the 47th largest emitter of greenhouse gases in the world, falling between Peru and Portugal.  And this only takes into account the emissions from its liquid fuel consumption.  For this study, the U.S. military’s 2015 consumption was compared with the 2014 World Bank country liquid fuel consumption. 

In 2017, the U.S. military purchased more than 269,000 barrels of oil a day, emitting more than 25,000 kt- CO2e by burning those fuels.  The Air Force accounted for $4.9 billion worth of this fuel, followed by the Navy at $2.8 billion, the Army at $947 million, and the Marines at $36 million. 

The Air Force and the Navy are not only the U.S. military’s largest purchasers of fuel, they also use the most polluting types of fuel.  The Air Force is the largest emitter of greenhouse gases at more than 13,000 kt CO2e, nearly double that of the Navy’s 7,800 kt CO2e. 

Despite this study’s findings and a general uptick in awareness, it’s unlikely that the U.S. military’s dependence on fossil fuels will change.  That’s because the military continues to pursue open-ended operations around the globe, and the lifecycle of its existing military equipment insures dependence on hydrocarbons for many years to come. 

***********

Web Links

U.S. military consumes more hydrocarbons than most countries — massive hidden impact on climate

Photo, posted July 8, 2016, courtesy of Alan Wilson via Flickr.

Earth Wise is a production of WAMC Northeast Public Radio.

Banning The Shark Fin Trade

July 4, 2019 By EarthWise Leave a Comment

Shark fins are considered a delicacy in many parts of the world, especially in China.  Shark fin soup, for example, is often served at engagement parties and weddings.  But the use of shark fins has come under increasing scrutiny in recent years, especially since an estimated one-third of fins are harvested from species deemed at risk.  

Many of the fins used in shark fin soup come from a practice known as “finning,” which is an inhumane and wasteful practice where the fins are hacked from live sharks and then the sharks are thrown back into the water and left to die.  According to U.N. estimates, 73 million sharks are killed every year for their fins.

The possession, sale, and distribution of shark fins is banned in 12 U.S. states, as well as in all European Union member states.

In 1994, Canada banned the practice of finning in its own waters, but allowed the import of fins to continue.  Canada has been one of the largest markets for shark fins outside Asia, importing nearly 300,000 pounds of shark fins last year.  But in late June, Canada passed a bill that bans both the import and export of shark fins harvested by shark finning.  They are the first G7 and the first G20 country to do so. 

But shark fins taken from sharks sustainably harvested for their meat will continue to be allowed in Canada.  While demand for shark fins is decreasing globally, demand for shark meat is rising.

Since sharks still face a myriad of environmental pressures, including illegal fishing and high bycatch rates, there are concerns that this Canadian ban oversimplifies the threats facing global shark populations. 

**********

Web Links

Canada becomes the first G20 country to ban shark fin trade

Photo, posted January 4, 2013, courtesy of Andrew Currie via Flickr.

Earth Wise is a production of WAMC Northeast Public Radio.

Two Million Solar Installations

July 1, 2019 By EarthWise Leave a Comment

Three years ago, we reported that the United States had installed its one millionth solar energy system, a feat that took 40 years to accomplish.  Recently, the Solar Energy Industries Association announced that there are now more than 2 million U.S. installations.

Analysts forecast that there will be 3 million installation in 2021 and 4 million in 2023.

California continues to lead the nation in installing solar power.  More than 50% of the first million installations were in that state and California accounted for 43% of the second million.  Its share is nevertheless slowly dropping with the growth of the residential solar sector that is rapidly diversifying across state markets.  Some places have seen extremely rapid growth.  In South Carolina, there were barely more than 1,000 cumulative installations in 2016; today, the state is home to more than 18,000 solar systems and expects to add 22,000 more over the next five years.

The five leading states in terms of number of solar installations are California, Arizona, New York, New Jersey, and Massachusetts.    Other states recently seeing rapid growth in solar installations are Texas, Utah, Florida, Rhode Island and Maryland.  Looking ahead, Illinois is forecast to grow from only 4,000 installations today to nearly 100,000 by 2024.  The top ten state markets apart from California expect to add nearly 750,000 installation over the next five years.

The United States is at least the third nation that is home to more than 2 million solar installations.  (Australia hit the milestone late least year and Japan actually topped 2 million in September 2014).

According to forecasts from analyst first Wood Mackenzie, by the year 2024, there will be on average one new solar installation every minute.

**********

Web Links

The United States surpasses 2 million solar installations

Photo, posted January 11, 2012, courtesy of the Oregon Department of Transportation via Flickr.

Earth Wise is a production of WAMC Northeast Public Radio.

Schools And Solar Power

June 19, 2019 By EarthWise Leave a Comment

A new study from Stanford University looked at the benefits of installing solar panels on the rooftops of schools.  According to the study, taking advantage of all the viable space for solar panels could allow schools to meet up to 75% of their electricity needs and reduce the education sector’s carbon footprint by as much as 28%.

Given the long list of spending priorities for schools, solar power seems like a luxury item.  But the Department of Energy estimates that K-12 schools spend more than $6 billion a year on energy and, in many districts, energy costs are second only to salaries.  In the higher education sector, yearly energy costs add up to more than $14 billion.  In total, educational institutions account for approximately 11% of energy consumption by U.S. buildings and 4% of the nation’s carbon emissions.

The Stanford study suggests that investments in the right solar projects combined with the right incentives from states could free up much-needed money in school budgets.

To no surprise, the study finds that three large, sunny states – Texas, California, and Florida – have the greatest potential for generating electricity from solar panels on school rooftops.

Apart from measurable effects on air pollution and electricity bills, solar installations at schools can also provide new learning opportunities for students.  In fact, some schools are already using data from their on-site solar energy systems to teach students basic ideas about fractions, as an example, as well as more sophisticated concepts such how shifting solar panel angles can affect power production.

According to the study, nearly all states could reap value from school solar projects.

**********

Web Links

What happens when schools go solar?

Photo, posted February 28, 2011, courtesy of Black Rock Solar via Flickr.

Earth Wise is a production of WAMC Northeast Public Radio.

Wildlife Bridges

June 17, 2019 By EarthWise Leave a Comment

Highway accidents involving animals are a big problem for both people and animals.  About 200 people die every year in the U.S. as a result of collisions with animals.  In total, one to two million large animals are killed by motorists every year.  And these crashes are expensive:  deer-car collisions cost an average of more than $8,000 each; elk-vehicle collisions about $25,000; and moose-vehicle collisions over $44,000. 

In the United States, there are 21 threatened and endangered species whose very survival is threatened by road mortalities.   These include Key deer in Florida, bighorn sheep in California, and red-bellied turtles in Alabama.

One solution that has been quite effective around the world in reducing car-animal collisions is wildlife overpasses and underpasses.  Crossings and fencing that guide animals over or under highways reduce collisions by 85-95%.

These traffic-spanning bridges and tunnels have been popular in Europe since the 1950s.  The overpasses usually look much like regular overpasses for cars but are decked out with native flora.  The underpasses, which assist shyer and smaller animals, are typically invisible to drivers.

Washington State has recently started building wildlife bridges and underpasses on Interstate 90.  These passes will allow elk, black bears, mountain lions, pika, and even trout to traverse what was once a near-impenetrable barrier of road.

Some animals that are accustomed to human structures start using the crossings almost immediately.  For others, there is learning curve.  As in many things, the early adapters are important as they provide paths and model behavior that more reticent animals learn to follow.

Wildlife bridges are a very good thing for wildlife and for people.

**********

Web Links

How wildlife bridges over highways make animals—and people—safer

Photo, posted July 22, 2017, courtesy of David Fulmer via Flickr.

Earth Wise is a production of WAMC Northeast Public Radio.

Our Growing Appetite For Energy

June 13, 2019 By EarthWise Leave a Comment

Energy consumption in the United States set a record high in 2018.  Overall, energy consumption reached 101.2 quadrillion BTUs or quads last year, breaking the previous record of 101.0 set in 2007.  Most of us are not too familiar with quadrillions of anything, nor with BTUs for that matter.  If it is any more illuminating, 101 quads are the equivalent of about 300 billion kilowatt hours.  Our energy use increased by 3.6% from 2017, which was the largest annual increase since 2010.

Wind, solar, and natural gas provided the largest increases in energy supply.  In 2018, solar and wind energy were both up by 0.18 quads, representing a 22% gain for solar and a 7.5% increase for wind.  Over the past ten years, overall renewable energy has doubled in the U.S., with wind increasing by a factor of 5 since 2008 and solar by an amazing factor of 48. 

Natural gas generation increased by 10.7%, or a total of 3 quads over the previous year.   The growth in natural gas use isn’t good news, but since much of it represents replacing coal, it at least corresponds to reduced greenhouse gas emissions.

The unfortunate part of our energy consumption is that the majority of it is still in the form of “rejected energy”.  It most often takes the form of waste heat, such as the warm exhaust from automobiles and furnaces.  The efficiency of our cars, lightbulbs and factories determines how much waste heat is produced and in turn how much fuel and electricity can be put to productive use.

**********

Web Links

US energy consumption hits record high in 2018, solar/wind/natural gas grow

Photo, posted April 27, 2015, courtesy of Mathias Appel via Flickr.

Earth Wise is a production of WAMC Northeast Public Radio.

Climate Change And Economic Inequality

June 3, 2019 By EarthWise 1 Comment

A new study by Stanford University looked at the effects of climate change on global economic inequality.  The study found that the gap between the economic output of the world’s richest and poorest countries is larger today than it would have been without global warming.

The warming climate has enriched cooler countries like Norway and Sweden while dragging down economic growth in warm countries such as India and Nigeria.  The results of the study showed that most of the poorest countries on Earth are considerably poorer than they would have been in the absence of rising temperatures.  At the same time, the majority of rich countries are richer than they would have otherwise been.

Detailed analysis of 50 years of annual temperature and GDP measurements for 165 countries demonstrated that growth during warmer than average years has accelerated in cool nations and slowed in warm nations.  Historical data clearly show that crops are more productive, people are healthier, and they are more productive at work when temperatures are neither too hot nor too cold.  That means that in cold countries, a little bit of warming can help but the opposite is true in places that are already hot.

For most counties, whether global warming has helped or hurt economic growth is pretty certain.  Tropical countries in particular tend to have temperatures far outside the ideal for economic growth and they are already among the poorest countries.  It is less clear how warming has influenced growth in countries in the middle latitudes, such as here in the United States.  Some of the largest economies are near the perfect temperature for economic output but continued warming in the future is likely to push them away from the temperature optimum.

**********

Web Links

Climate change has worsened global economic inequality

Photo, posted November 1, 2011, courtesy of CIAT via Flickr.

Earth Wise is a production of WAMC Northeast Public Radio.

The American Bumblebee

May 29, 2019 By EarthWise Leave a Comment

Pollinators, such as bees and bats, are vital for global food production.  They provide an ecological service that’s necessary for the reproduction of nearly 75% of the world’s flowering plants, including more than two-thirds of the world’s food crops.

Bumblebees are among the most important plant pollinators.  They pollinate many food crops, including apples, tomatoes, blueberries and legumes, as well as countless types of trees, shrubs, and wildflowers.  But researchers have documented declines in both the abundance and range of many bumblebee species.

The American bumblebee, which is native to North America, is one of them.  The species can currently be found in eastern Canada, throughout much of the Eastern United States, and much of Mexico. 

According to a new study led by York University and recently published in the Journal of Insect Conservation, the American bumblebee is critically endangered, and it faces imminent local extinction from Canada.  This is considered the highest and most at-risk classification before extinction. 

The researchers used data from three sources in their study: the Bumble Bee Watch (which is a citizen science project), the Bumble Bees of North America database (that has records dating back to the late-1800s), and their own field survey work.  They used the IUCN’s Red List assessment criteria to evaluate the status of the American bumblebee within its Canadian range.

The research team found that the species’ area of occurrence has decreased by approximately 70% and its relative abundance dropped by 89% from 2007-2016 when compared to 1907-2006. 

The American bumblebee can still be found throughout its Canadian range.  But immediate conservation action is desperately needed.  

*********

Web Links

Disappearing bumblebee species under threat of extinction

Photo, posted August 22, 2011, courtesy of Rachel Elaine via Flickr.

Earth Wise is a production of WAMC Northeast Public Radio.

Getting Rid Of Plastic Here And Abroad

May 23, 2019 By EarthWise Leave a Comment

Efforts in the fight against plastic pollution are really stepping up these days. 

New York State lawmakers have agreed to impose a statewide ban on most types of single-use plastic bags from retail sales.  The ban would be the second statewide ban after California, which banned the bags in 2016.  Hawaii effectively also has such a ban since all of the state’s counties have their own bans.

The New York ban would begin next March and would forbid stores from providing customers with single-use plastic bags.  There are a number of exceptions, including food takeout bags in restaurants, bags used to wrap deli or meat counter products, and newspaper bags.  New York counties could opt into a plan to charge a 5-cent fee on paper bags, with proceeds going to the state’s Environmental Protection Fund.  Some environmentalists point out, however, that paper bags have their own issues.  While they do decompose in landfills, they have a substantial carbon footprint since they are made from wood and being heavier, they are more costly to ship.  Business groups are concerned about the forthcoming ban based on increased costs.

Meanwhile, European Union member states have reached a provisional agreement to introduce restrictions on single-use plastic products.  In 2021. European citizens will say goodbye to plastic cutlery, plastic plates and plastic straws among other products.

According to the European Commission, plastics make up 85% of beach litter in the Mediterranean.  Large plastic pieces injure, suffocate, and often kill marine animals but microplastics have reached record levels of concentration – over a million fragments per square kilometer – in the Mediterranean.

Both here and abroad, the war on plastics is heating up.

**********

Web Links

Plastic Bags to Be Banned in New York; Second Statewide Ban, After California

The End Of Plastic Cutlery, Plates And Straws: EU Market Says Goodbye To Single-Use Plastic Products

Photo, posted March 20, 2007, courtesy of Flickr.

Earth Wise is a production of WAMC Northeast Public Radio.

Climate Change And Insurance

May 17, 2019 By EarthWise Leave a Comment

While there are still some people who remain dubious about the reality of climate change, insurance companies are not among them.  And, in fact, insurers are warning that climate change could make coverage for ordinary people unaffordable.

Munich Reinsurance, the world’s largest reinsurance firm, blamed global warming for $24 billion in losses from California’s recent wildfires.  Such costs could soon be widely felt as premium rises are already under discussion with insurance companies having clients in vulnerable parts of the state.

With the risk from wildfires, flooding, storms and hail increasing, the only sustainable option for the insurance industry is to adjust risk prices accordingly.  Ultimately, this may become a social issue.  Affordability of insurance is critical because if rates go up too much, many people on low and average incomes in some regions may no longer be able to buy insurance.

The great majority of California’s 20 worst forest fires since the 1930’s has occurred since the year 2000 driven by abnormally high summer temperatures and persistent drought. The reinsurance giant analyzed decades of data with climate models and concluded that the fires are likely driven by climate change.

It isn’t just wildfires.  Insurance premiums are also being adjusted in regions facing an increased threat from severe convective storms whose energy and severity are driven by global warming.  These include parts of Germany, Austria, France, southwest Italy, and the U.S. Midwest.

Linking extreme weather events to climate change is a bit like attributing the performance of a steroid-using athlete to drug use.  The connections are clearer in patterns than in individual disasters.  But the pattern these days is pretty clear.

**********

Web Links

Climate Change Could Make Insurance Unaffordable for Most People

Photo, posted June 12, 2013, courtesy of Jeff Head via Flickr.

Earth Wise is a production of WAMC Northeast Public Radio.

Coal Isn’t Even Cheap Anymore

May 15, 2019 By EarthWise Leave a Comment

Coal has historically been very cheap compared with many other energy sources and the reason is that it is so plentiful.  The United States has especially abundant quantities of the stuff – perhaps a quarter of the world’s estimated recoverable reserves.  Estimates are that at the rate at which we are currently using coal here, the remaining reserves would last about 325 years. 

That would be great, of course, if the use of coal was not relentlessly destructive to the environment, hazardous to human health, and a major driver for global warming.  Despite all of that, the Trump administration is a big booster of coal.

But coal has little chance of holding on to its current status, much less having some kind of renaissance.  According to a new report from renewables analysis firm Energy Innovation, nearly 75% of coal-fired power plants in the United States generate electricity that is more expensive than local wind and solar resources.   Wind power, in particular, can at times provide electricity at half the cost of coal.

Wind and solar power are growing by leaps and bounds.  The Guardian reported that by 2025, enough wind and solar power will be generated at low enough prices in the U.S. that it could replace 86% of the entire U.S. coal fleet with lower-cost electricity.

It has been known for some time that there are places where the so-called coal crossover has already taken place.   But this is actually far more widespread than previously thought.  Substantial coal capacity is currently at risk in North Carolina, Florida, Georgia and Texas.  By 2025, Indiana, Michigan, Ohio, and Wisconsin will join their ranks.

The biggest threat to coal is not regulators or environmentalists; it is economics.

**********

Web Links

Renewables Cheaper Than 75 Percent of U.S. Coal Fleet, Report Finds

Photo, posted May 1, 2011, courtesy of Alan Stark via Flickr.

Earth Wise is a production of WAMC Northeast Public Radio.

Building For Climate Change

May 13, 2019 By EarthWise Leave a Comment

The manifestations of climate change are creating increasingly familiar images:  floodwaters rising up house windows, charred buildings in the wake of wildfires, and homes and businesses demolished by storm winds. As these sorts of calamities become ever more common, changes to how houses are built are going to be necessary.

How can homes become more resilient against severe and unpredictable weather?

Research at Carlton University’s Sprott School of Business looks at this issue.

As an example, houses can be framed and finished in certain ways that help protect them from wind and flooding.  But such methods are currently only happening in the custom-build fringes of the housing sector.  Widespread adoption will require, at the minimum, significant changes to building codes.

Revising building codes is not an easy matter.  The codes themselves are highly technical and complex, and beyond that, the process Is often politicized.

Even simple things like hurricane ties, which are small pieces of hardware that prevent a roof from lifting during a severe wind are not now included in building codes.  Insurance companies support their use as inexpensive protection for houses.  But even though the overall cost is relatively minor, the building industry pushes back at the additional expense.

The need to reduce carbon emissions has created a push for sustainable housing.  But the increasingly erratic weather means that houses also need resilience and adaptation.  These features will inevitably add costs and incorporating them into building codes requires producing convincing business cases.

The U.S. experienced 394 natural catastrophe events last year costing $225 billion in damage.  Finding ways to make homes and businesses more resilient is not just a good idea; it is essential.

**********

Web Links

How to Start Weather-Proofing Homes for Unpredictable Weather

Photo, posted June 12, 2008, courtesy of U.S. Geological Survey via Flickr.

Earth Wise is a production of WAMC Northeast Public Radio.

Utility-Scale Solar On The Rise

May 8, 2019 By EarthWise Leave a Comment

According to research from Goldman Sachs, utility-scale solar power capacity is expected to grow by double digits globally over the next two years.  The growth will be driven by expanding use of the technology in the United States, Europe, the Middle East, and China.

Solar power is the world’s fastest growing source of electricity generation and is slowly taking market share from fossil fuels like coal and natural gas.  The transition is being driven by a combination of continuously lower prices for solar power and the impact of policies aimed at reducing emissions.

Utility-scale solar is defined as installations designed solely to feed electricity into the grid, in contrast to smaller-scale residential or commercial building units.  There are now solar farms larger than half a gigawatt in generating capacity.  According to the Goldman report, global utility-scale solar installations will reach 108 gigawatts in 2019, up 12% over the previous year, and will then grow another 10% to 119 gigawatts in 2020.

When residential and other smaller installations are included, most analysts expect global solar power capacity to soon hit 600 gigawatts.  To put this in perspective, the global capacity only reached 100 gigawatts in 2012 and was actually less than 10 gigawatts in 2007.

Even more dramatic than the growth of solar installations is the reduction in solar cost, and the two are obviously closely related.  Solar panel costs have dropped from around $70 per watt of electricity generated in 1980 to 36 cents per watt currently in the United States.  When favorable policies both from governments and related to corporate sustainability targets are added to the mix, the booming growth in solar power is easy to understand.

**********

Web Links

Large-scale solar power set for double-digit growth: Goldman Sachs

Photo, posted March 7, 2019, courtesy of Hedgerow Inc via Flickr.

Earth Wise is a production of WAMC Northeast Public Radio.

Shipping And Invasive Species

May 7, 2019 By EarthWise Leave a Comment

The increasing numbers of invasive species around the world are a major driver of biodiversity change and cause billions of dollars in economic damages annually.  Climate change is a major factor in the spread of invasive species, but a new study by McGill University suggests that global shipping growth will far outweigh climate change in the spread of non-indigenous pests to new environments in the coming decades.

One of the most significant ways in which the disparate regions of the world are interconnected is via transportation networks.   The global shipping network is the primary means by which materials and goods are moved worldwide, accounting for over 80% of world trade.  And for this reason, the global shipping network is responsible for much of the introduction of non-indigenous species across the planet.

Living organisms are often transported through ballast water, which is taken up to stabilize cargo vessels.  Other species are transported by biofouling, whereby they attach to the hulls of ships.  Taken together, these two pathways account for anywhere between 60 and 90% of marine bioinvasions.   (Terrestrial invaders are generally moved as a byproduct of shipping, for example by infesting wood packaging material).

The McGill study looked at trends in global shipping and how socioeconomic factors are driving change.  For example, China’s share of global container throughput has gone from 1.4% in 1990 to 20.1% in 2013.  So, the distribution and patterns of shipping have been changing dramatically and with it the spread of non-indigenous species.

Awareness of this issue is increasing.  For example, there have been policy initiatives such as the International Ballast Water Management Convention that is an effort to control bio-invasions through measures such as ballast exchange.  We need to take measures to limit the unintentional spread of species.

**********

Web Links

Global forecasts of shipping traffic and biological invasions to 2050

Photo, posted December 3, 2009, courtesy of Roger W via Flickr.

Earth Wise is a production of WAMC Northeast Public Radio.

Supermarkets And Zero-Waste

May 6, 2019 By EarthWise Leave a Comment

There are about 38,000 supermarkets in the United States alone and they are responsible for vast quantities of waste in the form of single-use plastic bags, plastic containers that store food products, and food waste as well.  Globally, over 80% of poll respondents feel strongly that companies should help improve the environment.  Responding to this message, markets are starting to make changes.

In a number of places, there are now markets that are package-free.  The Nada grocery store in Vancouver and Precycle in Brooklyn are examples of zero waste grocery stores.  Websites like Litterless provide online help for customers trying to find packaging-free grocery stores.

Markets are not only changing their packaging, they are using artificial intelligence to develop more sustainable production processes and seeking other ways to reduce waste.

On average, Americans throw away over 300 plastic bags a year, but an increasing number of grocery retailers are making commitments to more sustainable, plastic-free options.  It isn’t just small stores either.  Grocery giant Kroger plans to eliminate plastic bags in its stores by 2025.  When that happens, it means that 6 billion plastic bags will no longer be distributed.  Big Y stores will fully transition to reusable bags by next year.  More and more cities and states are banning or imposing fees on plastic bags. 

An interesting statistic shows that the age group of Americans that is leading the adoption of reusable grocery bags is not millennials but in fact is people over 50.  With multiple generations now indicating that they want shopping to be more sustainable, it is likely that supermarkets will strive to help make that happen.

**********

Web Links

Why More Supermarkets Are Committing to Zero-Waste

Photo, posted March 4, 2013, courtesy of Dean Hochman via Flickr.

Earth Wise is a production of WAMC Northeast Public Radio.

Rare Earths From Mining Waste

May 3, 2019 By EarthWise Leave a Comment

The 17 rare earth elements have become important parts of much of modern technology.  Despite their name, most of these elements are relatively plentiful in the earth’s crust, but because of their geochemical properties they are typically dispersed and not often found concentrated in minerals.  As a result, economically exploitable ore deposits are uncommon.  There are no significant sources in the U.S.

Rare earths play important roles in high-performance magnets, electric motors in vehicles, wind turbines, microphones and speakers, and in portable electronics like cell phones.  As these applications become ever larger, the need for additional sources of rare earths increases.

Researchers at Idaho National Laboratory and Rutgers University have studied a method for extracting rare-earth elements from mining waste that could greatly increase the world’s supply of these valuable materials.

It turns out that large amounts of rare earths exist in phosphogypsum, a waste product from producing phosphoric acid from phosphate rock.  The U.S. alone mined 28 million tons of phosphate rock in 2017.  (Phosphoric acid is used in the production of fertilizers and other products).

The researchers estimate that more than a billion tons of phosphogypsum waste sits in piles at storage sites across the U.S. alone.   World-wide, about 100,000 tons of rare earth elements per year end up in phosphogypsum waste.  This compares to the total current world-wide production of rare earth oxides of 126,000 tons.

The researchers studied methods for extracting the elements from the waste. A method utilizing a common environmental bacterium showed great promise.

There are concerns about residual radioactivity and other environmental issues in dealing with the waste material, but the world’s supply of rare earth elements might become much greater based on this research.

**********

Web Links

Critical Materials: Researchers Eye Huge Supply of Rare-Earth Elements from Mining Waste

Photo, posted June 19, 2015, courtesy of David Stanley via Flickr.

Earth Wise is a production of WAMC Northeast Public Radio.

High-Tide Flooding And Pollution

April 30, 2019 By EarthWise Leave a Comment

Global sea levels are steadily rising.  They are up 8 inches in the past century and now increasing at an average of 1.3 inches per decade.  As a result, the incidence of high-tide “sunny day” flooding is on the rise, especially along the U.S. East Coast.

Norfolk Virginia experienced fewer than 2 days of high-tide flooding a year in the 1960s; it had 14 in 2017.  Up and down the East Coast, flood days have increased by factors of 5 and more.

This has led to a form of pollution that hasn’t gathered much attention in the past:  when these floodwaters recede, they can carry debris, toxic pollutants and excess nutrients into rivers, bays, and oceans.

In the aftermath of high-tide flooding in Norfolk, Chesapeake Bay was littered with tipped-over garbage cans, tossed-away hamburgers, oil, dirty diapers, pet waste and all manner of other things.  Water that comes up on the landscape takes everything back into the river or ocean with it.

Analysis of tidal flooding along the Lafayette River in Norfolk indicated that just one morning of tidal flooding poured nearly the entire EPA annual allocation of nitrogen runoff for the river – nearly 2,000 pounds – into Chesapeake Bay.  The effects of excess nitrogen in the water are well-known and responsible for the toxic algal blooms that endanger aquatic life as well as human health.

According to the National Oceanic and Atmospheric Administration, high-tide flooding frequency along the southeastern coast of the U.S. rose 160% since 2000.  With the expected continuing rises in sea level, NOAA projects that as many as 85 days of high-tide flooding will occur along the coast by the year 2050.  It’s a big problem.

**********

Web Links

As High-Tide Flooding Worsens, More Pollution Is Washing to the Sea

Photo, posted September 20, 2018, courtesy of SC National Guard via Flickr.

Earth Wise is a production of WAMC Northeast Public Radio.

  • « Go to Previous Page
  • Page 1
  • Interim pages omitted …
  • Page 39
  • Page 40
  • Page 41
  • Page 42
  • Page 43
  • Interim pages omitted …
  • Page 49
  • Go to Next Page »

Primary Sidebar

Recent Episodes

  • An uninsurable future
  • Clean energy and jobs
  • Insect declines in remote regions
  • Fossil fuel producing nations ignoring climate goals
  • Trouble for clownfishes

WAMC Northeast Public Radio

WAMC/Northeast Public Radio is a regional public radio network serving parts of seven northeastern states (more...)

Copyright © 2026 ·