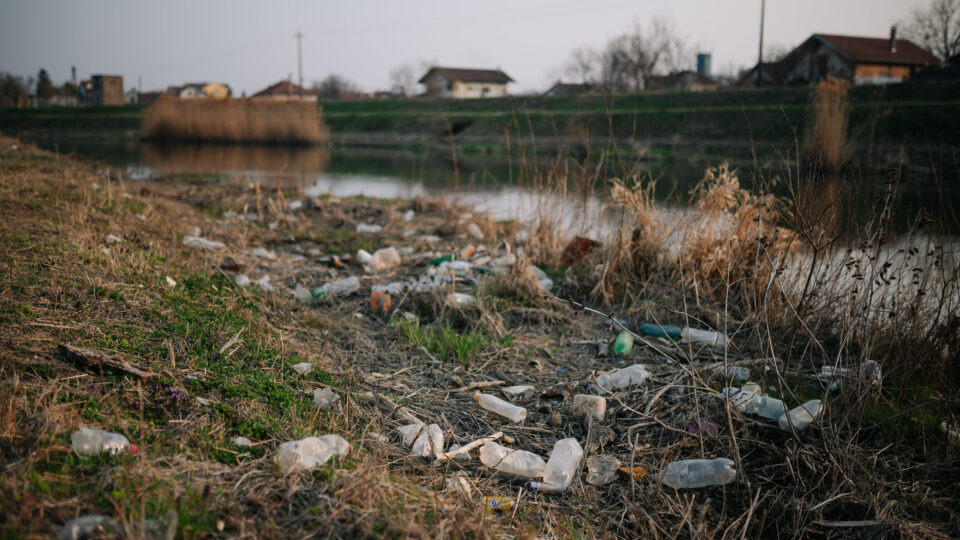
• Skip to main content
  • Skip to primary sidebar

Earth Wise

A look at our changing environment.

Hide Search
You are here: Home / Archives for asia

asia

Triple La Niña | Earth Wise

January 16, 2023 By EarthWise Leave a Comment

La Niña is an oceanic phenomenon consisting of cooler than normal sea-surface temperatures in the central and eastern tropic Pacific.  It is essentially the opposite of the better-known El Niño.   These sea-surface phenomena affect weather across the globe.  As one oceanographer put it:  when the Pacific speaks, the whole world listens.

There is currently a La Niña underway, and it is the third consecutive northern hemisphere winter that has had one.  This so-called triple-dip event is rather rare.  The only other times they have been recorded over the past 70 years were in 1954-56, 1973-76, and 1998-2001.

La Niñas appear when strong easterly trade winds increase the upwelling of cooler water from the depths of the eastern tropical Pacific Ocean near the equator.  This causes large-scale cooling of the ocean surface.  The cooler ocean surface modifies the moisture content of the atmosphere across the Pacific and can cause shifts in the path of jet streams that intensifies rainfall in some places and causes droughts in others.

These weather effects tend to include floods in northern Australia, Indonesia, and southeast Asia and, in contrast, drought in the American southwest.  In North America, cooler and stormier conditions often occur across the Pacific Northwest while the weather becomes warmer across the southern US and northern Mexico.

In the spring, the tropic Pacific essentially resets itself and starts building toward whatever condition will happen in the following winter, be it another La Niña or possibly an El Niño.   For the time being, forecasters expect the current La Niña to persist through February.

**********

Web Links

La Niña Times Three

Photo, posted March 10, 2007, courtesy of Gail via Flickr.

Earth Wise is a production of WAMC Northeast Public Radio

Prospects For Floating Solar | Earth Wise

October 10, 2022 By EarthWise Leave a Comment

Floating solar may power the future

Countries are trying to figure out how to get enough energy from solar and wind generation to completely decarbonize their economies.  According to some estimates, nations might have to devote between half a percent and five percent of their land area to solar panels to get the job done.  Half a percent is about the amount of the U.S. that is covered by paved roads.  While there is lots of open land in many parts of the country, covering it with solar panels might not be acceptable to farmers, conservationists, or other interested parties.

One way to deploy more solar panels without using up land is the use of floating solar panels.  Floating photovoltaic systems – also known as floatovoltaics – are becoming increasingly common, especially in Asia.  This year, China installed one of the largest floatovoltaic systems in the world on a reservoir near the city of Dezhou.

Floating solar panels stay cooler and run more efficiently than those on land.  The panels also help prevent evaporation from their watery homes and the shading they provide also help to minimize algal blooms.  Solar installations on reservoirs generally puts them near cities, making it easier to feed power into urban grids.

On the other hand, floating solar systems need to be able to withstand water and waves and are generally more expensive to build than land-based systems.

At present, the installed global capacity of floating solar is only about 3 gigawatts, compared with more than 700 gigawatts of land-based systems. However, reservoirs around the world collectively cover an area about the size of France.  Covering just 10 percent of them with floating solar could produce as much power as all the fossil-fuel plants in operation worldwide.

**********

Web Links

Solar Takes a Swim

Photo, posted March 7, 2019, courtesy of Hedgerow INC via Flickr.

Earth Wise is a production of WAMC Northeast Public Radio

A Hot July | Earth Wise

August 24, 2022 By EarthWise Leave a Comment

July was a hot month around the world

At the beginning of July, the National Oceanic and Atmospheric Administration’s monthly climate outlook predicted temperatures well above average across much of the United States.  The prediction was quite correct.  Beyond that, world-wide, there were multiple heat waves, especially in Europe and Asia, where there were thousands of heat-related deaths.  On July 19th, the United Kingdom had its hottest day ever reported with a temperature over 104 degrees.

In the U.S., a series of atmospheric high-pressure systems resulted in stagnant heat domes, which resulted in more than 150 million people living under heat warnings and advisories.  Nearly every part of the continental U.S. saw above-average temperatures.  There were record-breaking triple-digit highs in several states, sometimes persisting for days.

The south-central part of the country developed a ridge of high pressure that established a heat dome that acted like a lid, trapping hot air over that area.  The extreme heat persisted throughout the month, at times expanding to the Southwest, Upper Midwest, and Southeast.

In the second half of the month, the Great Plains experienced temperatures as high as 115 degrees.  Utah and Oklahoma both broke long-standing records for the most consecutive days on which temperatures exceeded 100 degrees.  Utah saw 16 straight days over 100.

In the Pacific Northwest temperatures reached 110 degrees in Dallasport, Washington, and 114 in Medford, Oregon.  In the Northeast, Newark, New Jersey saw a record-breaking five straight days over 100 degrees.

In Albany, New York, where the average daily high temperature is 82 degrees in July, there were 10 days in the 90s, with highs of 97 on three occasions.

July was a hot month indeed.

**********

Web Links

A July of Extremes

Photo, posted July 10, 2022, courtesy of Dominic Alves via Flickr.

Earth Wise is a production of WAMC Northeast Public Radio.

Who Can Solve The Plastic Waste Problem? | Earth Wise

June 21, 2022 By EarthWise Leave a Comment

Plastic packaging waste is a global problem.  It collects in the oceans, breaks down into microplastics, which are consumed by fish and in turn by people who eat the fish.  Only 14.5% of U.S. plastic waste is recycled.  Most of it ends up in landfills, where is remains undegraded for hundreds of years. 

A new international study explored the global patterns of plastic packaging waste.  The study found that three countries – the U.S., Brazil, and China – are the top suppliers of waste.  In terms of supply, the Americas generate 41% of the world’s production of plastic waste, Europe 24%, and Asia 21%.

That’s the plastics supply.  As far as the consumers actually creating waste are concerned, the Americas represent 36% of the world’s packaging consumption, Asia 26%, and Europe 23%.

Packaging high-protein food such as meat, fish, and dairy is a major contributor to the waste problem.  Plastic for this purpose is hard to replace and international exports exacerbate the problem, accounting for about 25% of plastic packaging waste.

International agreements typically focus on restrictions and fees on production.  But that mostly creates strong incentives to simply relocate polluting activities to developing countries, which is a zero-sum game.  There need to be incentives for consumers to reduce plastic use such as taxes on waste management, refunds on returning bottles, single-use plastic bans, and so on.

Who can solve the plastic waste problem?  Everyone along the supply chain as well as the final consumers have to be part of the solution for reducing plastic waste.

**********

Web Links

Producers and consumers must share burden of global plastic packaging waste

Photo, posted March 29, 2022, courtesy of Ivan Radic via Flickr.

Earth Wise is a production of WAMC Northeast Public Radio.

January Climate Report Card | Earth Wise

March 9, 2022 By EarthWise Leave a Comment

A report card on the climate

The global climate is a complicated thing.  While overall trends are relatively straightforward to understand, the details can seem confusing.

January was the sixth-warmest January in the 143 years of global climate record keeping.  The global land and ocean surface temperature was 1.6 degrees Fahrenheit above the 20th century average.

Meanwhile, the United States had its coolest January since 2014, although the month still ranked nearly a degree above the long-term average across the nation.  This January was also the driest January in eight years and was one of the top- 15 driest Januarys on record.  That being said, there was the so-called Bomb Cyclone late in the month that dumped 1-2 feet of snow and brought blizzard conditions along the eastern seaboard and set a one-day snowfall record in Boston.

Global conditions and regional and local conditions can be very different.  In the big picture, January was the 46th consecutive January and the 445th consecutive month with temperatures above the 20th century average.

And while the US had a fairly cool January, South America saw its second-warmest January on record, Asia had its fourth warmest, and Oceania had its seventh warmest.

Apart from temperatures, Antarctic sea ice coverage was the second smallest January extent in 44 years.  Arctic ice was 208,000 square miles below the 1981-2010 average, although it was the largest since 2009.

Even as the global climate warms, local and regional climate conditions will continue to have unique and variable characteristics over the course of time.  Every time there’s a bout of cold weather, it isn’t time to stop being concerned about climate change.

**********

Web Links

January 2022 was Earth’s 6th warmest on record

Photo, posted January 6, 2013, courtesy of Christopher Michel via Flickr.

Earth Wise is a production of WAMC Northeast Public Radio.

Melting Himalayan Glaciers | Earth Wise

February 1, 2022 By EarthWise Leave a Comment

Accelerating melting of Himalayan glaciers poses a massive threat to regional water supply

The great mountain ranges of central Asia, including the Himalayas, contain the third-largest deposit of ice and snow in the world, trailing only Antarctica and the Arctic.  The Himalayan range contains about 15,000 glaciers, and is part of a region widely referred to as the Third Pole due to its extraordinary reserves of freshwater.

But in recent years, scientists have observed an increase in the rate of Himalayan glacier loss.  According to a new study led by researchers from the University of Leeds in the UK, the accelerating melting of the Himalayan glaciers threatens the water supply of millions of people in Asia. 

In the study, researchers reconstructed the reach of the Himalayan glaciers during the Little Ice Age, which was the last major glacier expansion 400-700 years ago. They found that these glaciers began losing ice 10 times faster during the modern era.  In fact, the glaciers have shrunk from a peak of nearly 11,000 square miles to around 7,500 square miles today.   

This exceptional acceleration of melting of the Himalayan glaciers could have significant implications.  Hundreds of millions of people rely on Asia’s major river systems for food and energy, and depend on these glaciers to feed rivers during the dry seasons.  These rivers include the Brahmaputra, Ganges, and Indus.  The changing global climate could disastrously impact water resources and livelihoods of the Greater Himalayan region.

According to the research team, people living in these regions have already seen changes that are unlike anything witnessed for centuries.  This study is the latest to confirm that these changes are accelerating and pose a significant threat to entire nations and regions. 

**********

Web Links

Himalayan glaciers melting at ‘exceptional rate’

Photo, posted March 13, 2018, courtesy of Sarunas Burdulis via Flickr.

Earth Wise is a production of WAMC Northeast Public Radio.

Coral Reef Status Report | Earth Wise

December 23, 2021 By EarthWise Leave a Comment

The status of the world's coral

In October, the Global Coral Reef Monitoring Network released the first-ever report collecting global statistics on the world’s corals.  It documents the status of reefs across 12,000 sites in 73 countries over 40 years.  Overall, the news is not good, but there were some bright spots.

From 2009 to 2018, the world has lost 14% of its corals, corresponding to about 4,500 square miles of coral.  Global warming has led to prolonged marine heatwaves that trigger coral bleaching.  Local pollution has also damaged reefs.   The International Panel on Climate Change has reported that 2 degrees Celsius of global warming would wipe out 99% of the world’s corals.

The report does show that corals can recover globally if given a decade of cooler waters.  Some places in the world – particularly the Coral Triangle in Asia, which contains nearly a third of the world’s coral – have actually seen coral growth over the past decade. 

The Global Coral Reef Monitoring network started collecting data in 1978.  Coral health was fairly steady until 1998 when the first mass bleaching event occurred, triggered by a powerful El Niño event.  For the next 12 years, corals recovered nicely, but then bleaching events in 2010 and 2015-17 took their toll.

The Pacific, Australia, and the Caribbean have all seen major decreases in coral.  The Coral Triangle is a major exception which is thought to be a result of genetic diversity among the region’s corals.

Coral conservationists globally are working to protect corals and to actively restore them.  The situation is fairly dire, but there continue to be reasons for hope.

**********

Web Links

Finding Bright Spots in the Global Coral Reef Catastrophe

Photo, posted October 13, 2015, courtesy of Albert Straub via Flickr.

Earth Wise is a production of WAMC Northeast Public Radio.

Could Lyme Disease Be Eradicated? | Earth Wise

November 22, 2021 By EarthWise Leave a Comment

Eradicating lyme disease

Tiny ticks are a big problem.  Measuring only three to five millimeters in size, ticks are widely distributed around the world.  They are external parasites, feasting on the blood of birds, reptiles, amphibians, and mammals – including humans.

According to estimates from the Centers for Disease Control and Prevention, ticks infect an estimated 476,000 people with Lyme disease in the United States every year.  Lyme disease is caused by a bacterium called Borrelia burgdorferi that lurks in wild mice. Ticks that feed on the mice become infected and can then in turn infect people and animals.   

The disease is not only a problem in the United States, but in other parts of North America, Europe and Asia as well.  It often causes a characteristic “bullseye” rash and flu-like symptoms. If left untreated, it can lead to serious long-term health problems.

Currently, lyme disease is treated using antibiotics.  But antibiotics kill a wide range of bacteria – including healthy gut bacteria – which can lead to additional health issues and more antibiotic resistance.

A recent discovery by researchers from Northeastern University in Boston could allow Lyme disease to be eradicated in the wild.  The researchers found that a compound called hygromycin A is deadly to the bacterium that causes Lyme disease but harmless to animals and has little effect on most other bacteria. 

The little-known antibiotic cleared Lyme disease infection in mice, both when administered via injection and when ingested using bait.  As a result, dropping feeding baits could eradicate Lyme disease from whole areas or even entire countries.  The first field trial will be next summer.

**********

Web Links

Drug treatment for Lyme disease could lead to its eradication

Photo, posted June 21, 2017, courtesy of NIAID via Flickr.

Earth Wise is a production of WAMC Northeast Public Radio.

Banning Gas Cars | Earth Wise

November 12, 2021 By EarthWise Leave a Comment

Many states and countries have passed gas car bans

The transition to electric vehicles from gas-powered vehicles is essential for reducing greenhouse gas emissions as well as air pollution in general.  Currently, transportation is responsible for 30% of greenhouse gas emissions in the United States.

There is no doubt that there is surging interest in electric cars.  There are now millions of them being sold around the world each year.  But they still represent a small fraction of new car sales in most places.  Notable exceptions are several European countries such as Norway and Switzerland where plug-in vehicles are dominant.  In the United States, on the other hand, EVs still represent less than 3% of new car sales.

Given the urgency in reducing vehicle emissions, many countries around the world have devised plans, goals, or laws to end the sale of gasoline cars.  Gas car bans vary quite a bit around the world, but they are being implemented in many places.

There are 28 countries and US states that have imposed gas car bans to take effect over the next five to 20 years.  These include European countries like Norway, Belgium, Austria, Netherlands, Denmark, Iceland, Ireland, Sweden, Scotland, Slovenia, the UK, France, and Spain.  Asian countries include South Korea, India, Japan, China, Singapore, Sri Lanka, and Taiwan.  In the Middle East, Israel and Egypt have announced bans.  Here in the US, New York and California both have bans starting in 2035.  Canada also has announced a ban.

Car manufacturers have seen the writing on the wall.  Most have started adding EVs to their lineups.  Many have announced their own timetables for phasing out gas cars entirely.  There are more than 15 new electric models available this year and there are many more to follow next year.

**********

Web Links

Over 25 Countries And U.S. States Are Planning to Ban Gasoline Powered Cars

Photo, posted January 24, 2009, courtesy of Oran Viriyincy via Flickr.

Earth Wise is a production of WAMC Northeast Public Radio.

Global Light Pollution

October 14, 2021 By EarthWise 1 Comment

Light pollution increasing globally

Light pollution is excessive or obtrusive artificial light. It’s a consequence of industrial civilization.  Too much artificial light can cause a host of problems, including disrupting ecosystems, causing adverse health effects, and wasting energy. 

According to a new study led by researchers from the University of Exeter in the U.K., global light pollution has increased by at least 49% over 25 years.  But this figure only includes light visible via satellites.  Scientists estimate that the true increase may be significantly higher – up to 270% more globally. 

That’s because there is a hidden impact of LED technology that isn’t accounted for in the satellite data. LEDs emit more blue light than previous lighting technologies, but satellite sensors fail to pick up this blue light.   This leads to a large underestimate of global light pollution.

The researchers examined light pollution from 1992 to 2017.  They found persistently increasing light pollution in Asia, South America, Oceania and Africa.  In Europe, detected light increased until around 2010, after which it leveled off.  In North America, artificial light appears to be on the decline.  However, the researchers point out that the satellites inability to detect blue light of LEDs means that light pollution has likely actually increased in most locations.

Light pollution has widespread impacts on both animals and plants.  For example, light pollution can confuse the migratory patterns of animals and change predator-prey relationships.   It’s also been shown to cause trees to bud earlier in spring.      

While there’s no off switch for the planet, there are ways that we could reduce the amount of light drastically with little impact on our lives. 

**********

Web Links

Rapid increase in global light pollution

Photo, posted November 2, 2008, courtesy of Timothy Tsui via Flickr.

XXXXXXXXXXXXXXXXXX

Carbon From 25 Cities | Earth Wise

September 10, 2021 By EarthWise Leave a Comment

Urban carbon emissions are a major driver of climate change

There are roughly 10,000 cities in the world, defined as places with at least 50,000 inhabitants with a sufficient population density.  Roughly half the world’s population lives in cities.

Urban carbon emissions are one of the world’s biggest problems with respect to the climate.  A new study has determined that just 25 cities globally are responsible for 52% of urban greenhouse gas emissions.

The study gathered data on greenhouse gas emissions in 167 cities in 53 countries.  The results were that megacities in Asia, such as Shanghai and Tokyo, were among the biggest total emitters, and that major cities in Europe, the US, and Australia tended to have larger per capita emissions.  Several Chinese cities, however, matched levels seen in developed countries.  Researchers tracked emissions over time in 42 of the cities studied.  Some cities saw declining emissions in the period between 2005 and 2016.  These included Oslo, Houston, Seattle, and Bogota.  Others saw large increases, including Rio de Janeiro, Johannesburg, and Venice.

The largest sources of emissions are power generation, industry, and transportation.  In a third of the cities, road transportation alone accounted for over 30% of emissions.  (Railways, waterways, and aviation combined only accounted for less than 15% of total emissions).

Half of the world’s population lives in cities, but cities are responsible for more than 70% of greenhouse gas emissions.  Thus, cities have a big responsibility for the decarbonization of the global economy.  Of the 167 cities in the study, 113 have set emission-reduction targets.  But as the study shows, cities have much more work to do to meet the goals of the Paris Climate Agreement.

**********

Web Links

Two Dozen Large Cities Produce 52 Percent of Urban Carbon Emissions

Photo, posted December 1, 2017, courtesy of Hector Galbis via Flickr.

Earth Wise is a production of WAMC Northeast Public Radio.

July Was A Scorcher | Earth Wise

September 2, 2021 By EarthWise Leave a Comment

Record setting July 2021 was the hottest month ever

July 2021 has the unfortunate distinction as being the world’s hottest month ever recorded according to global data from the National Oceanic and Atmospheric Administration.   July is typically the warmest month of the year, but this July was the warmest month of any year on record.

The combined global land and ocean surface temperature was 62.07 degrees Fahrenheit, which is 1.67 degrees above the 20th century average.  This was the highest monthly average since records began 142 years ago.  It broke the previous record set in July 2016 and tied in 2019 and 2020.

The Northern Hemisphere was 2.77 degrees above average.  Asia had its hottest July on record.  Europe had its second hottest July on record.  Places like Africa, Australia, and New Zealand all had top-ten warmest Julys.

Other aspects of the changing climate included the observation that Arctic sea ice coverage for July was the fourth-smallest in the 43-year record.  Interestingly, Antarctic sea ice extent was actually above average in July.  Global tropic cyclone activity this year so far is above normal for the number of named storms.  In the Atlantic basin, the formation of the storm Elsa on July 1 was the earliest date for a 5th named storm.

It remains very likely that 2021 will rank among the 10 hottest years on record.  Extreme heat is a reflection on the long-term climate changes that were outlined recently in a major report released by the Intergovernmental Panel on Climate Change.  These latest global observations add to the disturbing and disruptive path that the changing climate has set for the world.

**********

Web Links

It’s official: July was Earth’s hottest month on record

Photo, posted July 15, 2021, courtesy of Lori Iverson/National Interagency Fire Center via Flickr.

Earth Wise is a production of WAMC Northeast Public Radio.

Coal In The UK And Asia | Earth Wise

August 20, 2021 By EarthWise Leave a Comment

Coal power is in a permanent decline

Coal was the driving force of the British industrial revolution beginning in the 18th century.  Coal was used for manufacturing iron, heating buildings, driving locomotives, and more.  Annual coal production in the UK peaked in the year 1913 at 316 million tons.  Until the late 1960s, coal was the main source of energy produced in the UK.

Recently, Britain announced that it plans to phase out coal power entirely by October 2024, one year earlier than its previous target date.  This is on the heels of a dramatic decline in coal usage over the past decade.  In 2012, coal accounted for 40% of the UK’s power generation.  By 2020, that number was 1.8%.

In both Europe and the United States, coal power is generally significantly more expensive than renewable power from the sun and wind.  As a result, market forces have driven the demise of coal power in those places.

The situation is different across much of Asia where coal power remains cost competitive.  Five Asian countries – China, India, Indonesia, Japan, and Vietnam – still have plans to build more than 600 new coal-fired power plants, which is bad news for the environment.  In 2020, China produced more than half of the world’s coal power, which reflects both the growth of coal in Asia and its decline in the U.S. and Europe.

Despite all this, experts predict that it will be more expensive to run almost all coal plants globally than to build new renewable energy projects by the year 2026.  Sooner or later, coal power will no longer make its unfortunate contributions to the world.

**********

Web Links

UK Aims to Dump Coal Early, While Asia Stays the Course

Photo, posted March 8, 2021, courtesy of Stanze via Flickr.

Earth Wise is a production of WAMC Northeast Public Radio.

Rising Seas In The Maldives | Earth Wise

May 24, 2021 By EarthWise Leave a Comment

Rising seas are threatening the Maldives

The Republic of Maldives is an archipelago in the Indian Ocean, southwest of Sri Lanka and India and about 400 miles from the Asian mainland.  It is one of the world’s most geographically dispersed sovereign states, the smallest Asian country by land area, and, with a little over 500,000 inhabitants, the second least populous country in Asia.  With its spectacular scenic beauty, it is also a premier tourist attraction.

With more than 80% of its 1,190 coral islands standing less than 1 meter above sea level, the Maldives has the lowest terrain of any country in the world.  As a result, the Maldives is particularly vulnerable to the sea level rise associated with climate change.

Some studies predict a grim future for the Maldives as well as other low-lying islands.  One study concluded that the islands could become uninhabitable by 2050 as wave-driven flooding becomes more common and freshwater becomes limited.

The Maldives government has explored plans to purchase land on higher ground in other countries.  Planners are also working to enhance the resilience of the country’s current islands.   An example is Hulhumalé, a newly constructed artificial island northeast of the country’s capital, Malé.

Construction of Hulhumalé began in 1997 and it now covers 1.5 square miles, making it the fourth largest island in the Maldives.  Its population is now more than 50,000, with more than 200,000 expected to eventually move there.  The new island, built by pumping sand from the seafloor onto a coral platform, rises about 2 meters above sea level.  The extra height could make the new island a refuge for Maldivians driven off lower-lying islands by the rising seas.

**********

Web Links

Preparing for Rising Seas in the Maldives

Photo, posted June 15, 2009, courtesy of Elena N via Flickr.

Earth Wise is a production of WAMC Northeast Public Radio.

Climate Change And Farming Productivity | Earth Wise

May 3, 2021 By EarthWise Leave a Comment

Climate change is already hindering farm productivity

The future potential impacts of anthropogenic climate change on global agricultural systems has been well studied, but how human-caused climate change has already affected the agricultural sector is not as well understood.  But a new study led by researchers at Cornell University and supported by the USDA National Institute of Food and Agriculture and the National Science Foundation examined this issue. 

Despite important agricultural breakthroughs in technology, fertilizer use and global trade during the past 60 years, it turns out that the climate crisis is already eroding farm productivity.  According to the study, which was recently published in the journal Nature Climate Change, global farming productivity is 21% lower than it could have been without climate change.  This is the equivalent of losing approximately seven years of farm productivity increases since the 1960s. 

The researchers developed a model linking annual changes in weather and productivity with output from the latest climate models over six decades to quantify the effect of anthropogenic climate change on what economists call “total factor productivity.” This measure captures the overall productivity of the agricultural sector. 

The research team reviewed 200 variations of the model, but the results remained largely consistent:  anthropogenic climate change is already slowing down global food production.  The researchers say the historical impacts of climate change have been larger in naturally warmer climates, like in parts of Africa, Asia, and Latin America.   

Climate change is not some distant problem to solve in the future.  It is already having an impact on the planet and it needs to be addressed now.

**********

Web Links

Climate change cut global farming productivity 21% since 1960s

Photo, posted October 2, 2013, courtesy of the United Soybean Board via Flickr.

Earth Wise is a production of WAMC Northeast Public Radio.

Mollusks And Microplastics | Earth Wise

January 26, 2021 By EarthWise Leave a Comment

Microplastics are contaminating marine creatures

Plastic debris comes in all different shapes and sizes, but pieces that are less than five millimeters in length are called microplastics.  Microplastics are everywhere, including in the food we eat, the water we drink, and the air we breathe.

Much of the oceanic microplastic pollution comes from the breakdown of plastic litter.  Another source of microplastic pollution is microbeads.  Microbeads, which are sometimes added to cleansing and exfoliating personal care products, pollute the environment when they get flushed down the drain.  

According to a new study by researchers at Hull York Medical School and the University of Hull in the U.K., mussels, oysters and scallops have the highest levels of microplastic contamination among seafood.  The research team examined 50 studies between 2014 and 2020 to determine the levels of microplastic contamination globally in fish and shellfish.  The team found that microplastic content was 0-10.5 microplastics per gram in mollusks, 0.1-8.6 microplastics per gram in crustaceans, and 0-2.9 microplastics per gram in fish.  

The researchers found that mollusks collected off the coasts of Asia were the most heavily contaminated with microplastics.  China, Australia, Canada, Japan and the United States are among the largest consumers of mollusks, followed by Europe and the U.K.

While the human health implications of consuming microplastics are not well understood, early evidence from other studies suggest they do cause harm. 

According to the research team, more data is needed from different parts of the world in order to better understand how microplastics vary between different oceans, seas, and waterways.

**********

Web Links

Highest levels of microplastics found in molluscs, new study says

Photo, posted September 3, 2007, courtesy of Andrew Malone via Flickr.

Earth Wise is a production of WAMC Northeast Public Radio.

The Search For Lingering Ash | Earth Wise

January 12, 2021 By EarthWise Leave a Comment

Ash trees are critically endangered

Ash trees are some of the most important plants along riverbanks and in wetlands.  There are three ash species in North America:  the white, green, and black ash.  Unfortunately, all three species are critically endangered because of the emerald ash borer.

The emerald ash borer is an exotic beetle from Asia that first showed up in the U.S. in southeastern Michigan in the summer of 2002.  The adult beetles do little damage but the larvae feed on the inner bark of ash trees and disrupt the tree’s ability to transport water and nutrients.  The beetles are now found in 35 states and 5 Canadian provinces and have killed hundreds of millions of ash trees.

The greatest hope for preserving ash tree species relates to lingering ash, which are those rare trees that have managed to survive the onslaught of the emerald ash borer. The idea is that those trees have some natural genetic resistance to the borer.  Getting seeds and cuttings from lingering ash and propagating them at nurseries may be the only way to get ash trees back into the natural landscape.

Lingering ash are extremely rare and therefore very hard to find.  As a result, researchers are reaching out to the public to help with the search and report the presence of these surviving trees in woodlands.

Researchers want to find large, mature trees left among those that were killed by the invasive insect and therefore display great resilience.  In Kentucky, university and Division of Forestry researchers are making use of software tools to engage the assistance of the public. An app called TreeSnap allows people to provide data on trees that they find in their community, on their property, or out in the wild.

**********

Web Links

Researchers Ask Public for Help Finding Lingering Ash Trees

Help Our Nation’s Trees!

Photo, posted May 31, 2014, courtesy of Katja Schulz via Flickr.

Earth Wise is a production of WAMC Northeast Public Radio.

The Hot Year Continues | Earth Wise

December 8, 2020 By EarthWise Leave a Comment

the warming trend continues

The National Oceanic and Atmospheric Administration’s monthly global climate report for October reports yet another month of high temperatures.  October 2020 was the fourth-hottest October on record, continuing the pace for the year to be the second hottest on record.

The 10 warmest Octobers have occurred since 2005 and the seven warmest have all occurred in the last seven years.  Europe had its warmest October ever, surpassing the previous record set in 2001.

For the year to date, the global temperature was a full degree Celsius (or 1.8 degrees Fahrenheit) above the 20th century average.  This was just 0.03 Celsius degrees lower than the record set in 2016.   Europe and Asia have had their warmest year-to-date period on record.

Other notable observations in the report included that Arctic sea ice coverage was almost 37% below the 1981-2010 average and was the smallest October coverage on record.  The previous record was set last year.

Heat records were set around the world including parts of the northern and western Pacific Ocean, southern North America, South America, eastern Europe, the northern Middle East, the eastern Mediterranean Sea, southern Asia, and in small areas across the Indian and Atlantic Oceans.

Despite the record global temperatures, the Northern Hemisphere’s snow coverage in October was the 10th largest over the past 53 years.  The snow coverage in North America was the largest on record for October.

Adding in the extremely active hurricane season, with 12 hurricanes and 29 tropical depressions, weather around the world continues to be anything but typical.

**********

Web Links

Remarkably warm October fuels march toward 2nd-hottest year

Photo, posted February 8, 2016, courtesy of Jasmin Toubi via Flickr.

Earth Wise is a production of WAMC Northeast Public Radio.

The Arctic Northeast Passage May Open | Earth Wise

November 12, 2020 By EarthWise Leave a Comment

arctic passage and climate change

The Northwest Passage is the sea route between the Atlantic and Pacific oceans through the Arctic Ocean.  It goes along the northern coast of North America, traveling though the Canadian Arctic Archipelago.  In the past, it was the domain of intrepid explorers like Roald Amundsen.  Because of the receding ice in the Arctic, in recent years it has become possible to travel the Northwest Passage by cruise ship.

The Northeast Passage connects the same two oceans along the Arctic coasts of Norway and Siberia.  The sustained loss of sea ice is now leading to accessibility of Arctic sea passages through this route.

Compared with the customary route through the Strait of Malacca in Malaysia and the Suez Canal, using the Northeast Passage could reduce the travel distance between Europe and northwest Asia by one-third.  This would reduce the expense of transportation and lower environmental pollution.  Many Asian countries have a strong strategic and economic interest in Arctic shipping.  Russia would gain strong competitive advantages for its liquified natural gas industry.

According to a recent study at the Northwest Institute of Eco-Environment and Resources of the Chinese Academy of Sciences, the continuing warming of the Arctic seas is likely to result in the Northeast Passage being navigable for open water ships by next year and will continue to be increasingly hospitable to marine traffic.

The economic and strategic benefits to the opening of the Northeast Passage are quite clear.  What is also clear is that the underlying cause of the opening of the passage – the dramatic loss of Arctic sea ice – is not beneficial to the world at all and is a harbinger of troubling things in our future.

**********

Web Links

Arctic Northeast Passage may be Navigable in Near Future

Photo, posted September 24, 2005, courtesy of Paul Downey via Flickr.

Earth Wise is a production of WAMC Northeast Public Radio.

The Hottest September | Earth Wise

November 5, 2020 By EarthWise Leave a Comment

The hottest September

Here’s a news item that is like many other recent news items:  September 2020 was the hottest September since 1880, according to the National Oceanic and Atmospheric Administration.   The warm September is a part of a year that so far is poised to be at least the second hottest year in the 141-year climate record.

The ten warmest Septembers on record have all occurred since 2005, and the seven warmest Septembers have occurred in the past seven years.

So far, the year-to-date average global temperature has been the second warmest on record, being just 0.07 degrees Fahrenheit lower than the record year-to-date temperature set in 2016.  Expectations are that 2020 will end up somewhere among the three warmest years on record for the globe.

September was warm in many places around the world.  California and Oregon had their warmest September ever.  Europe had its warmest September on record, Asia had its second warmest September on record as did Australia and South America. 

So far, it has been the hottest year-to-date on record in Europe, Asia, and the Gulf of Mexico.  No land or ocean areas anywhere had record-cold year-to-date temperatures. 

Global temperatures represent an average over the entire surface of the planet.  The fact that the global temperature is now nearly one Celsius degree above the 20th century average means that a vast amount of heat has been added in order to warm all the oceans, atmosphere, and land by that much.  So, every uptick in global temperature is a big deal.

Meanwhile, the average Arctic sea ice coverage for September was the second smallest on record.  The 14 smallest minimum annual sea ice extents have all occurred in the past 14 years.

**********

Web Links

Earth just had its hottest September on record

Photo, posted September 2, 2020, courtesy of Tim Vrtiska via Flickr.

Earth Wise is a production of WAMC Northeast Public Radio.

  • Go to page 1
  • Go to page 2
  • Go to page 3
  • Go to Next Page »

Primary Sidebar

Recent Episodes

  • Energy From Rice Straw | Earth Wise
  • California Flooding | Earth Wise
  • The Race For EV Batteries | Earth Wise
  • Turning Carbon Into Stone | Earth Wise
  • Tracking Global Forest Changes | Earth Wise

WAMC Northeast Public Radio

WAMC/Northeast Public Radio is a regional public radio network serving parts of seven northeastern states (more...)

Copyright © 2023 ·