• Skip to primary navigation
  • Skip to main content
  • Skip to primary sidebar

Earth Wise

A look at our changing environment.

  • Home
  • About Earth Wise
  • Where to Listen
  • All Articles
  • Show Search
Hide Search
You are here: Home / Archives for forecasts

forecasts

Glaciers in Venezuela

June 24, 2024 By EarthWise Leave a Comment

There are nearly 200,000 glaciers in the world.  About 91% of them are in Antarctica and 8% in Greenland.  The rest are scattered across nearly 50 countries.  The non-polar country with the most glaciers is actually Pakistan, which has over 7,200 of them.  But as the world continues to warm, glaciers are shrinking back, and many are disappearing altogether.

Venezuela, once home to six glaciers, has become the first country in the Americas to lose all of its glaciers.  Slovenia is considered to be the first country to lose its glaciers in modern times, perhaps as long as 30 years ago.  Glacial thawing has been worsening over the past decade throughout the Andes, which cover parts of Colombia, Venezuela, Bolivia, Ecuador, Peru, Chile, and Argentina.

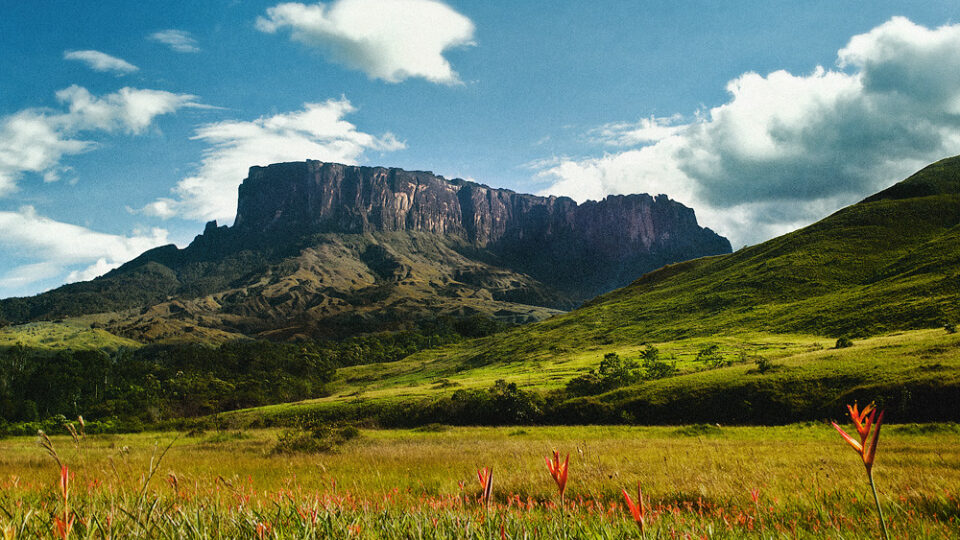
Five of Venezuela’s glaciers had largely melted away by 2011.  The Humboldt glacier, which is on the highest peak in the Cordillera de Mérida mountain range in Venezuela, has now been declared as too small to be classified as a glacier.  It once covered over a thousand acres; it now has less than 5 acres of ice.  The US Geological Survey defines glaciers as ice bodies extending 25 acres or more.

The loss of glaciers in the Andes has serious consequences for communities that live on their slopes and depend upon glacial melt for water and for energy and food production. 

At least 80% of glaciers worldwide are on track to mostly disappear by the year 2100 because of global warming.  Given that previous forecasts estimated that the Humboldt glacier might last another decade, the prospects for the world’s remaining glaciers are not good.

**********

Web Links

Venezuela becomes first nation in the Americas to lose all glaciers

Photo, posted November 11, 2012, courtesy of Tim Snell via Flickr.

Earth Wise is a production of WAMC Northeast Public Radio

Wildfire Smoke And Global Weather | Earth Wise

June 1, 2023 By EarthWise Leave a Comment

In 2019 and 2020, wildfires burned 72,000 square miles in Australia, roughly the same area as the entire country of Syria. During the nine months when the fires raged, persistent and widespread plumes of smoke filled the atmosphere.

These aerosols brightened a vast area of clouds above the subtropical Pacific Ocean.  Beneath these clouds, the surface of the ocean and the atmosphere cooled.  The effect of this was an unexpected and long-lasting cool phase of the Pacific’s La Niña-El Niño cycle.

A new modeling study by the National Center for Atmospheric Research in Boulder, Colorado quantified the extent to which aerosols from the Australian wildfires made clouds over the tropical Pacific reflect more sunlight back towards space.  The resultant cooling shifted the cloud and rain belt known as the Intertropical Convergence Zone northward.  These effects may have helped trigger the unusual three-year-long La Niña, which lasted from late 2019 through 2022.

The impacts of that La Niña included intensifying drought and famine in Eastern Africa and priming the Atlantic Ocean for hurricanes.  2020 was the most active tropical storm season on record, with 31 storm systems, including 11 that made landfall in the U.S.

The study highlights widespread multi-year climate impacts caused by an unprecedented wildfire season.  The wildfires set off a chain of events that influenced weather far from where the fires occurred.  In the future, climate experts will need to include the potential effects of wildfires in their forecasts.

**********

Web Links

How Wildfire Smoke from Australia Affected Climate Events Around the World

Photo, posted December 19, 2019, courtesy of Simon Rumi via Flickr.

Earth Wise is a production of WAMC Northeast Public Radio

Saving Money By Predicting The Wind | Earth Wise

July 1, 2022 By EarthWise Leave a Comment

Managing an electrical grid that utilizes significant amounts of intermittent generation sources – solar and wind power – brings with it some unique challenges.  There are abundant wind resources in this country and more and utilities are taking advantage of these resources.   But there are times when there is more wind, times when there is less wind, and times when there is no wind at all.   Utilities need accurate wind forecasts to determine when they need to generate or purchase energy from alternative sources.

Poor wind forecasts can cost utilities a lot of money.  If there is overprediction – that is, when there is less wind than predicted – utilities have to purchase energy off the spot market at higher prices.  If there is underprediction – more wind than predicted – utilities may needlessly burn fossil fuels and waste money that way. 

The National Oceanic and Atmospheric Administration produces wind forecasts using its High-Resolution Rapid Refresh (HRRR) weather model, which provides hourly updated forecasts for every part of the United States looking forward up to 48 hours.  The model generates predictions of wind speed and direction at multiple levels of the atmosphere, information that utilities can use to predict the output of their wind turbines.

A new study by economists and scientists from Colorado State University and NOAA estimated the financial impact of the HRRR model on wind farm production.  The research team calculated that increasingly accurate weather forecasts over the last decade have saved consumers over $150 million a year.   Estimates are that if the newest model was in use in previous years, the savings would have been over $300 million a year.

**********

Web Links

NOAA wind forecasts result in $150 million in energy savings every year

Photo, posted May 2, 2022, courtesy of California Energy Commission via Flickr.

Earth Wise is a production of WAMC Northeast Public Radio.

The Gulf Of Mexico Dead Zone | Earth Wise

July 19, 2021 By EarthWise Leave a Comment

Forecasting the 2021 dead zone in the Gulf of Mexico

Every summer, a so-called dead zone forms in the Gulf of Mexico.  It is primarily caused by excess nutrient pollution from human activities in urban and agricultural areas throughout the Mississippi River watershed. 

When these excess nutrients reach the Gulf, they stimulate excess growth of algae, which eventually die and decompose, depleting oxygen as they sink to the bottom.  These low oxygen levels near the Gulf bottom cannot support most marine life.  Animals that are sufficiently mobile – such as fish, shrimp, and crabs – generally swim out of the area.  Those that can’t move away are stressed or killed by the low oxygen.

A team of scientists funded by the National Oceanic and Atmospheric Administration issues an annual forecast for the dead zone based upon a suite of models that incorporate river flow and nutrient data. 

The 2021 forecasted area is somewhat smaller than, but close to, the five-year measured average for the dead zone, which is 5,400 square miles, roughly the size of the state of Connecticut.   Each year, these forecasts are reported as comparisons to long-term averages, but the problem is that the long-term average is unacceptable.

The Interagency Mississippi River and Gulf of Mexico Hypoxia Task Force has set a goal of reducing the size of the dead zone to a five-year average of 1,900 square miles – about a third of the current average.

Large reductions in nutrient loads have been called for in federal and state action plans for nearly 20 years, but clearly these reductions have not yet been sufficient. The Interagency Task Force continues to provide information for managing nutrient loads in the Mississippi River Basin. 

**********

Web Links

Average-sized ‘dead zone’ forecast for Gulf of Mexico

Photo, posted October 6, 2020, courtesy of Christine Warner via Flickr.

Earth Wise is a production of WAMC Northeast Public Radio.

Reduced Air Travel And Weather Forecasts | Earth Wise

December 16, 2020 By EarthWise Leave a Comment

The pandemic is affecting weather forecasting

There have been countless stories about the major and minor changes in the world caused by the Covid-19 pandemic.  A few of those changes, such as reductions in pollution and traffic, have been positive.  Most have been decidedly negative.

One of the stranger things that has happened is that the pandemic has affected the quality of weather forecasting by sharply reducing the amount of atmospheric data routinely collected by commercial airliners.

It turns out that atmospheric observations from passenger and cargo flights are among the most important data used in weather forecasting models.  These observations are made by instruments aboard thousands of airliners, mostly based in North America and Europe.  The observation program has been in place for decades.  The data is transmitted in real time to forecasting organizations around the world, including the National Weather Service.  About 40 airlines participate in the program, which has equipment aboard about 3,500 aircraft.  Here in the US, Delta, United, American, and Southwest Airlines participate, as do UPS and FedEx.

During the first few months of the pandemic, air traffic declined by 75% or more worldwide.  As a result, atmospheric observations dropped by the same percentage.  A government research study showed that when weather forecasting models receive less data on temperature, wind, and humidity from aircraft, the accuracy of forecasts was reduced.

The amount of data from aircraft has increased in recent months as air travel has picked up to roughly 50% of pre-pandemic levels.  So, the observation program is on the mend.  Nonetheless, impaired weather forecasting is just another unexpected result of the global pandemic.

**********

Web Links

Slump in Air Travel Hindered Weather Forecasting, Study Shows

Photo, posted July 15, 2017, courtesy of Daria Nepriakhina via Flickr. Photo by Photo by Daria / epicantus.

Earth Wise is a production of WAMC Northeast Public Radio.

Solar On Commercial Buildings | Earth Wise

September 17, 2020 By EarthWise Leave a Comment

commercial solar panels

The United States installed 3.6 gigawatts of photovoltaic solar capacity in the first quarter of this year to reach a total installed capacity of 81.4 GW.  That is enough to power about 16 million American homes.  More than 2/3 of that capacity has been installed during the past five years.  

There has been a boom in solar installations in recent years and, until the Covid-19 pandemic stuck, 2020 was expected to be the biggest year yet.  Now the unprecedented health, social, and economic conditions in our country creates great uncertainty in such forecasts.

Nevertheless, the opportunities for growth in solar power continue to be substantial.  A new report from the energy research firm Wood Mackenzie looked at the prospects for using the roof space of commercial buildings for solar power.

Currently, just 3.5% of commercial buildings in the U.S. have solar panels on their roofs.  Another 1% of those buildings are attached to solar projects located off-site.  The report looked at how many buildings are potential targets for solar projects.

After accounting for buildings that are too small or that use too little electricity to make solar power a worthwhile investment, the report estimated that 70% of commercial buildings in the U.S. – amounting to some 600,000 sites – are candidates for solar installations.  Doing this would provide 145 GW of new solar capacity, which is nearly twice as much as currently exists in this country. 

Commercial solar installations have their own unique logistical and financial challenges.  While utility solar can scale to lower costs and residential solar has financing opportunities, commercial solar has neither.  But ultimately, it represents an important opportunity for our future energy system.

**********

Web Links

U.S. Commercial Rooftops Hold 145 Gigawatts of Untapped Solar Potential

Photo, posted June 25, 2014, courtesy of Rob Baxter via Flickr.

Earth Wise is a production of WAMC Northeast Public Radio.

Tracking Locust Swarms | Earth Wise

June 12, 2020 By EarthWise Leave a Comment

Plagues of locusts have been reported since the times of the Egyptian pharaohs.  In recent history, there have been desert locust plagues during multiple decades of the 20th century.  Since January, a very large population of locusts gathered in Kenya and has destroyed over 2,000 square miles of pasture and crop land.  Swarms have since reached portions of Ethiopia, Somalia, Uganda, and South Sudan.  Apart from East Africa, there are locust swarms in Yemen and other Middle East countries and in Pakistan as well.  The current situation continues to represent an unprecedented threat to food security and livelihoods in East Africa.  Locust swarms can range in size from less than half a square mile to hundreds of square miles, each containing 20 to 40 million locusts.

The National Oceanic and Atmospheric Administration uses a powerful air quality model to track the movement and deposition of pollution from wildfires, volcanoes and industrial accidents.  Called the HYSPLIT dispersion model, it has now been refined for the purpose of tracking swarms of locusts.

Because desert locusts are passive fliers that drift with the wind, the model’s high-quality data on wind speed and direction can lead to accurate predictions of where the locusts will go and when.

NOAA is working with the United Nations Food and Agriculture Organization – the FAO.  The new web application based on HYSPLIT is being used by the FAO to issue forecasts and warnings to affected countries about forthcoming waves of locust swarms.  Such forecasts enable local officials to conduct aerial spraying to reduce the impact of desert locusts which can destroy grains, grasses and other greens that are life-sustaining foods for entire regions.

**********

Web Links

NOAA teams with United Nations to create locust-tracking application

Photo, posted November 20, 2004, courtesy of Niv Singer via Flickr.

Earth Wise is a production of WAMC Northeast Public Radio.

Being Ready For Adverse Weather

December 25, 2017 By EarthWise Leave a Comment

https://earthwiseradio.org/wp-content/uploads/2017/12/EW-12-25-17-Being-Ready-for-Adverse-Weather.mp3

Severe weather is a major cause of death and destruction.   Recent hurricanes provided all too many examples.   The catastrophic flooding from Hurricane Harvey led to more than 60 deaths and necessitated thousands of emergency rescues.   And yet, increasingly, weather events like hurricanes don’t occur without warning and accurate weather forecasts are increasingly common.

[Read more…] about Being Ready For Adverse Weather

A Refuge For Black Spruce

August 23, 2016 By WAMC WEB

https://earthwiseradio.org/wp-content/uploads/2016/08/EW-08-23-16-Northwoods-Warming.mp3

In the Canadian province of Quebec, a study of more than 26,000 trees across an area the size of Spain forecasts winners and losers in a changing climate.

[Read more…] about A Refuge For Black Spruce

Primary Sidebar

Recent Episodes

  • An uninsurable future
  • Clean energy and jobs
  • Insect declines in remote regions
  • Fossil fuel producing nations ignoring climate goals
  • Trouble for clownfishes

WAMC Northeast Public Radio

WAMC/Northeast Public Radio is a regional public radio network serving parts of seven northeastern states (more...)

Copyright © 2026 ·